Download
1 / 17
170 likes | 359 Views
This guide outlines the key elements involved in complicated decision problems, emphasizing the importance of values, objectives, decisions, uncertainties, and consequences. It highlights how to identify what decision makers care about, the importance of tradeoffs between objectives, and the sequential nature of decisions. Additionally, it provides insights into constructing influence diagrams to visualize the relationships between different decision components, helping to clarify their interconnectedness and impact on outcomes.

E N D
Elements of Decision Problems • Given a complicated decision problem, one should first identify the elements of the problem • Values and objectives • Decisions to make (and alternatives) • Uncertain events (and outcomes) • Consequences
Values and Objectives • Values • What the decision maker cares about • Objectives • The specific things to be achieved • Include objects and the direction of preference • e.g. Maximizing profits, maximizing life quality • Some objectives can be related • e.g. Improving the image of a company may in turn bring it more profits • There can be tradeoffs among multiple objectives • e.g. Economic benefits gained by using chemical insecticide lead to health risk • A requisite model includes all objectives that matter and only those that matter in the decision context at hand
Decisions to Make • Decision Alternatives • Specific alternatives • e.g. Purchasing or leasing a car • Choose a specific value out of a range of possible values • e.g. Deciding the amount of money to invest in a project • Consider the possibility of no action and of waiting to obtain more information • Sequential Decisions • Multiple decisions are ordered sequentially • Dynamic decisions: a future decision may depend on exactly what happened before • e.g. First decide purchase or lease a car, next decide what kind of car to purchase or lease, then decide where to get the car, … • It is important to identify the order in which the decisions occur
Uncertain Events • Uncertainty about the future makes decision problems hard • It is important to focus on only the relevantuncertain events • The possible outcomes can be finite or within some range of values • e.g. whether it will rain or not, the annual profits of a company • Complicated decision problems can involve interdependent uncertain events • e.g. The interest rate of car mortgage depends on the market economy status • The time sequence of uncertain events in sequential decisions is critical • What events are unknown and what information is available before a decision is made
Consequences • The final results after the last decision has been made and the last uncertain event has been resolved • Defining Measurement Scales for Consequences • Consequences corresponding to objectives with natural attribute scales can be measured objectively • e.g. monetary values, time, length, weight, etc. • Consequences corresponding to objectives without natural attribute scales • Measured indirectly with proxies • e.g. GPA as a measure of a person’s intelligence • Measured subjectively using an attribute rating scale • e.g. The quality of life can be measured using a five-point Likert scale questionnaire (best, better, satisfactory, worse, and worst) • Tradeoffs among multiple objectives
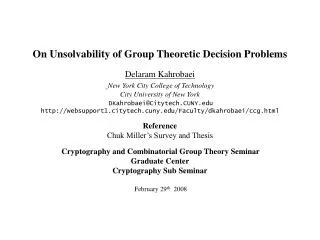
Chance Node Decision Node Venture Succeeds or Fails Invest? Return on Investment Computer Industry Growth Computation Node Overall Satisfaction Payoff Node Influence Diagrams Influence Diagram of a Venture Capitalist’s Decision Problem
Influence Diagrams (Cont.) Relationships between nodes are symbolized with arrows or directed arcs Distinctions are made here between sequence and dependence arcs only for teaching purposes. Once you are familiar with the differences, you can use solid arcs throughout the influence diagram like the convention used in the textbook
Influence Diagrams (Cont.) • Influence Diagrams and Fundamental Objectives Hierarchy • The Payoff node corresponds to the most general objective (located at the upper-most level) in the fundamental-objectives hierarchy • The computation nodes correspond to the objectives at the lower levels in the hierarchy
Constructing an Influence Diagram • No set strategy is given; a good approach is to put together a simple version of the diagram first and then add details as necessary • Steps for Constructing Influence Diagram • 1. Identify the decisions to be made. If there are more than one decision, determine their time sequence and draw sequence arcs to connect the decision nodes • 2. Structure fundamental objectives hierarchy and convert the fundamental objectives into payoff or computation nodes in the influence diagram • 3. Identify relevance relationships between the decision nodes and computation nodes or payoff node and draw corresponding arcs • 4. Identify all the uncertain events • 5. Identify the sequence relationships between the chance nodes and decision nodes and draw corresponding arcs • 6. Identify the relevance relationships between the chance nodes and draw corresponding arcs
Constructing an Influence Diagram • Steps for Constructing Influence Diagram (Cont.) • 7. Identify the relevance relationships between the chance nodes and computation nodes or payoff node and draw corresponding arcs • 8. Check the appropriateness of the influence diagram (any missing and/or irrelevant information)
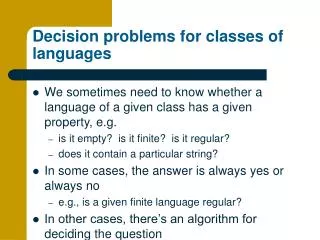
EPA Example The Environmental Protection Agency (EPA) often must decide whether to permit the useof an economically beneficial chemical that may induce cancer (carcinogenic). Furthermore, the decision often must be made without perfect informationabout either the long-term benefitsor health hazards. Alternative courses of actions are to permit the use of the chemical, restrict its use, or to ban it all together. Tests can be runto learn something about the carcinogenic potential, and survey datacan give an indication of the extent to which people are exposed when they do use the chemical. These pieces of information are both important in making the decision. For example, if the chemical is only mildly toxic and the exposure rate is minimal, then restricted use may be reasonable. On the other hand, if the chemical is only mildly toxic but the exposure rate is high, then banning its use may be imperative.
Survey Lab Test Exposure Rate Net Value Carcinogenic Potential Economic Value Cancer Cost Usage Decision? Influence Diagram of the EPA Decision Problem Net Value Cancer Cost Economic Value
Survey Lab Test Cancer Risk Exposure Rate Net Value Carcinogenic Potential Economic Value Cancer Cost Usage Decision? Influence Diagram of the EPA Decision Problem (adding a computation node)
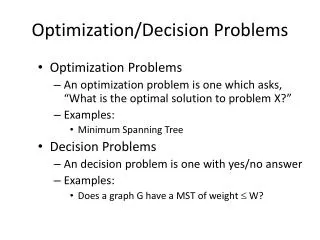
Decision Trees • Decision Trees Display A Decision Problem in Detail • Decision trees explicitly identify the sequence of decisions/events (from left to right) • Decision trees show all possible future scenarios • One branch for each decision alternative • One branch for each outcome of an uncertain event (outcomes must be mutually exclusive and collectively exhaustive)
Decision Trees (Cont.) Decision Alternative Chance Node Consequence Widely Success $3,000 Business Decision Node Flop $0 Business Result Outcome of Uncertain Event Investment Choice $200 Savings Decision Tree of the Investment Decision Problem
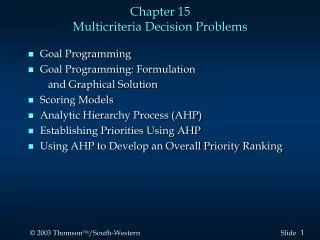
Product-Switching Example A company needs to decide whether to switch to a new product or not. The product that the company is currently making provides a fixed payoff of $150,000. If the company switches to the new product, its payoff depends on the level of sales. It is estimated that there are about 30% chance of high-level sales ($300,000 payoff), 50% chance of medium-level sales ($100,000 payoff), and 20% chance of low-level sales (losing $100,000). A survey which costs $20,000 can be performed to provide information regarding the sales to be expected. If the survey shows high-level sales, then there are about 60% chance of high-level sales and 40% chance of medium-level sales when the company sells the product. On the other hand, if the survey shows low-level sales, then there are about 60%chance of medium-level sales and 40% chance of low-level sales when the company sells the product. 16
Old $150,000 $130,000 Survey High High $300,000 (0.6) $280,000 New (0.5) $100,000 (0.4) Medium $80,000 $150,000 Old Perform Survey $130,000 Survey Low Medium $100,000 (0.6) $80,000 (0.5) New -$20,000 Low -$100,000 (0.4) -$120,000 $150,000 Don’t Perform Old $150,000 New $300,000 (0.3) High $300,000 Medium $100,000 (0.5) $100,000 -$100,000 (0.2) Low -$100,000 17