Download
1 / 29
290 likes | 396 Views
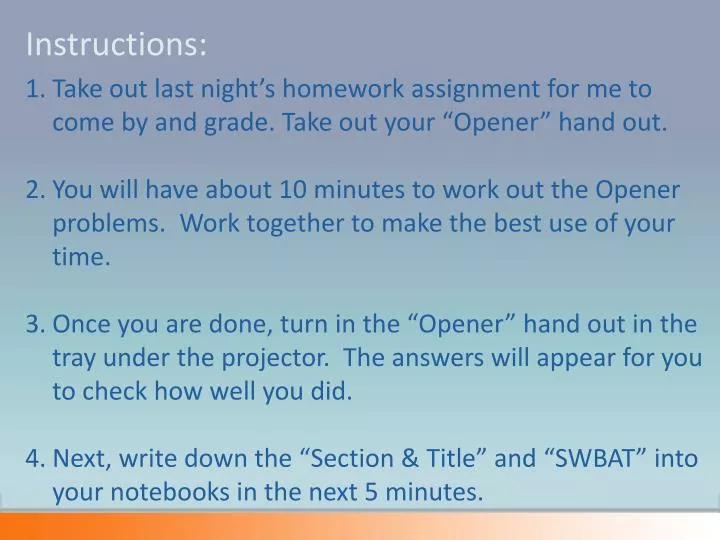
Instructions:. Take out last night’s homework assignment for me to come by and grade. Take out your “Opener ” hand out. You will have about 10 minutes to work out the Opener problems. Work together to make the best use of your time.

E N D
Instructions: Take out last night’s homework assignment for me to come by and grade. Take out your “Opener” hand out. You will have about 10 minutes to work out the Opener problems. Work together to make the best use of your time. Once you are done, turn in the “Opener” hand out in the tray under the projector. The answers will appear for you to check how well you did. Next, write down the “Section & Title” and “SWBAT” into your notebooks in the next 5 minutes.
Work together. Use whiteboards. Use laptops. No Opener Today! Opener Use the resources on the internet and each other to help you relearn the concept.
1.2 & 1.3 Functions and Their Graphs D1 & D2 SWBAT evaluate using functional notation. SWBAT determine the domain and range from a graph. SWBAT determine if the graph represents a function by applying the vertical line test. Write down the date, Section #, Title and Learning Objective(s) into your notebook.
Please take a couple of minutes to check your answers to the even numbered problems in the previous assignment. Correct the ones you got wrong and write the total number of correct over the total number in the top right hand corner. Be prepared to either ask a question or answer one.
… Now let’s start the new lesson by reviewing our objectives …… Underline the words that have been omitted …Be prepared to answer! SWBAT evaluate using __?__ notation. SWBAT determine the __?__ and __?__ from a graph. SWBAT determine if the graph __?__ a __?__ by applying the __?__ __?__ __?__.
Key Concepts LISTEN LOOK What is a function? (pg. 16) A functionf from a set A to a set B is a relation that assigns to each element x in the set A exactly one element y in the set B. The set A is the domain ( or set of inputs) and the set B contains the range (set of outputs). Write down what you want into “Key Concepts” as you Look & Listen.
Key Concepts LISTEN LOOK What is functional notation? • Allows user to determine what the input and output values are easily. • Looks like f(x). Read as “f of x.” • The input/domain is the “x.” The output/range is the “f(x).”
Key Concepts LISTEN LOOK Reading Domain & Range from a Graph The leftmost x – value is -6. The rightmost x – value is 6. The bottommost y – value is 0. The topmost y – value is 6. The leftmost x – value is - . The rightmost x – value is + . The bottommost y – value is -. The topmost y – value is +. The leftmost x – value is - . The rightmost x – value is + . The bottommost y – value is -. The topmost y – value is 15. Fence in the Function!
Key Concepts LISTEN LOOK Reading Domain & Range from a Graph Range: Domain: Fence in the Function!
y y y 4 4 4 2 2 2 x x x -4 -4 -4 -2 -2 -2 2 2 2 4 4 4 -2 -2 -2 -4 -4 -4 Key Concepts LISTEN LOOK Vertical Line Test: If a vertical line passes through only 1 point, then the graph represents a function. Function? Function? Function?
Key Concepts LISTEN LOOK Write down what you want into “Key Concepts” as you Look & Listen.
Now let’s try together. Use whiteboards. Which one of the following represents a function? Justify! SWBAT evaluate using function notation.
Now let’s try together. Use whiteboards. Evaluate the function at each specified value or expression of the independent variable and simplify. SWBAT evaluate using function notation.
Now let’s try together. Use whiteboards. Evaluate the function at each specified value or expression of the independent variable and simplify. SWBAT evaluate using function notation.
Now let’s try together. Use whiteboards. Evaluate the function at each specified value or expression of the independent variable and simplify. SWBAT evaluate using function notation.
Now you try. Write in notebook. Evaluate the function at each specified value or expression of the independent variable and simplify. SWBAT evaluate using function notation.
Now you try. Write in notebook. Evaluate the function at each specified value or expression of the independent variable and simplify. SWBAT evaluate using function notation.
Now you try. Write in notebook. Evaluate the function at each specified value or expression of the independent variable and simplify. SWBAT evaluate using function notation.
Now you try. Write in notebook. Evaluate the function at each specified value or expression of the independent variable and simplify. SWBAT evaluate using function notation.
How do we get there? LISTEN LOOK SWBAT determine domain & range from a graph.
Now let’s try together. Use whiteboards. SWBAT determine domain & range from a graph.
Now let’s try together. Use whiteboards. SWBAT determine domain & range from a graph.
Now let’s try together. Use whiteboards. SWBAT determine domain & range from a graph.
Now you try. Write in notebook. SWBAT determine domain & range from a graph.
Now you try. Write in notebook. SWBAT determine domain & range from a graph.
Now you try. Write in notebook. SWBAT determine domain & range from a graph.
Now you try. Write in notebook. SWBAT determine domain & range from a graph.
Assignment: Pg. 25 #27, 30, 35 Pg. 38 #1 – 4, 11 – 16
Key Concepts LISTEN LOOK Reading Domain & Range from a Graph • Go to the x – axis for the domain. • Try to either go up or down and intersect (hit) the graph. • If you can do this everywhere, then the domain is all real numbers. • If you can’t then, you have to include the boundary value(s). • Repeat this for the y – axis for the range. Write down what you want into “Key Concepts” as you Look & Listen.