Download
1 / 61
610 likes | 734 Views
What is wrong with the science of global warming a statement, not a question. True Believers - Doomsayers. Majority. Al Gore D - TN. A tale of two senators. People Trying to Do Good Science. Minority. James Inhofe R - OK. Deniers.

E N D
What is wrong with the science of global warminga statement, not a question
True Believers - Doomsayers Majority Al Gore D - TN A tale of two senators People Trying to Do Good Science Minority James Inhofe R - OK Deniers
The conclusions of Natural Science are true and necessary, and the judgment of men has nothing to do with them. Galileo Galilei Scientific ideals • Scientists… • are truth seekers. • make rational arguments. • try to minimize biases. • demand naturalistic explanations supported by empirical evidence that is testable against the natural world. • are skeptical. • are honest peer-reviewers. • require reproducibiliy of results when possible. • know that models or theories must be altered or discarded when data contradicts them.
Acne • Afghan poppies destroyed / more potent • Afghan poppies more potent • Africa in conflict • African summer frost • aggressive weeds • Air France crash • air pressure changes • Al Qaeda and Taliban Being Helped • allergy season longer • Alps melting • Amazon a desert • American dream end • amphibians breeding earlier (or not) • ancient forests dramatically changed • animals head for the hills • animals shrink • Antarctic grass flourishes • Antarctic ice grows (or shrinks) • Antarctic sea life at risk • anxiety treatment • archaeological sites threatened • Arctic bogs melt • Arctic ice free • Arctic ice melt faster • Arctic tundra lost • Arctic warming (or not) • asthma • Atlantic less salty / more salty • atmospheric circulation modified • attack of the killer jellyfish • avalanches reduced / increased • carbon crimes • camel deaths • cancer deaths in England • cannibalism • childhood insomnia • cholera • circumcision in decline • cirrus disappearance • civil unrest • cloud increase (or decrease) • cockroach migration • cod go south • coffee threatened • cold climate creatures survive • cold spells (Australia) • cold wave (India) • cold weather (world) • conflict with Russia • consumers foot the bill • coral reefs dying / growing • cougar attacks • crabgrass menace • crime increase • crocodile sex • crops devastated • crumbling roads • curriculum change • cyclones (Australia) • Baghdad snow • bananas grow • beer and bread prices to soar • beer better (or worse) • beetle infestation • billion homeless • billions face risk • billions of deaths • bird distributions change • bird strikes • birds confused • birds driven north • blackbirds stop singing • blood contaminated • brain eating amoebae • brains shrink • bridge collapse (Minneapolis) • British monsoon • brothels struggle • bubonic plague • building collapse • building season extension • bushfires • butterflies move north About 800 things are attributed to global warming Here is a sampling … http://www.numberwatch.co.uk/warmlist.htm
Increase of hurricanes? • Christopher Landsea – NOAA Scientist (Atlantic Oceanographic and Meterological Laboratory • Contributing author of IPCC reports 2 and 3, and invited to also be on 4. • October 2004 press conference called by Kevin Trenberth (IPCC, NCAR) entitled “Experts to warn global warming likely to continue spurring more outbreaks of intense hurricane activity”
Paleoclimate C. R. Scotese, 2006, Paleomap project http://www.scotese.com/earth.htm
Paleoclimate record C. R. Scotese, 2006, Paleomap project
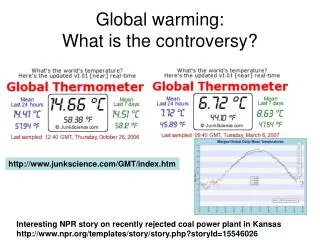
Inquiring minds want to know… So, what about the instrumental record? There are three major global indices of temperatures that incorporate station data: CRU, GISS (7364 stations) and NOAA. Each of these groups primarily relies on the GHCN (Global Historical Climatology Network) for their input data. GHCN has two versions: 1 and 2. Each version contains max, min, mean and adjusted mean. A large proportion of the GHCN network is composed of the USHCN (US Historical Climatology Network).
Surface temperatures: instruments The United States Historical Climatology Network (USHCN) is a data set of daily and monthly records of basic meteorological variables from 1218 observing stations across the 48 contiguous United States. Stevenson station 1890 – 1979 NWS - NOAA
GISS Surface Temperature Analysis: 2010 third warmest of the past 131 years 2010-02-18
Missing stations? • In January 2010, the Canadian News Service reported the findings of two climate skeptics, Joseph D’Aleo, a meteorologist, and E. Michael Smith, a computer programmer. They found that • In the 1970s, nearly 600 Canadian weather stations fed surface temperature readings into a global database assembled by the U.S. National Oceanic and Atmospheric Administration (NOAA). • Today, NOAA only collects data from 35 stations across Canada. Worse, only one station -- at Eureka on Ellesmere Island -- is now used by NOAA as a temperature gauge for all Canadian territory above the Arctic Circle. • The Canadian government, meanwhile, operates 1,400 surface weather stations across the country, and more than 100 above the Arctic Circle, according to Environment Canada. • Using the agency’s own figures, Smith shows that in 1991, almost a quarter of NOAA’s Canadian temperature data came from stations in the high Arctic. The same region contributes only 3% of the Canadian data today.
Missing Stations? They say NOAA collects no temperature data at all from Bolivia -- a high-altitude, landlocked country -- but instead “interpolates” or assigns temperature values for that country based on data from “nearby” temperature stations located at lower elevations in Peru, or in the Amazon basin. The result, they say, is a warmer-than-truthful global temperature record. “NOAA . . . systematically eliminated 75% of the world’s stations with a clear bias towards removing higher latitude, high altitude and rural locations, all of which had a tendency to be cooler,” the authors say. “The thermometers in a sense, marched towards the tropics, the sea, and to airport tarmacs.”
Goddard Institute for Space StudiesNASA Q. If SATs cannot be measured, how are SAT maps created ?A. This can only be done with the help of computer models, the same models that are used to create the daily weather forecasts. We may start out the model with the few observed data that are available and fill in the rest with guesses (also called extrapolations) and then let the model run long enough so that the initial guesses no longer matter, but not too long in order to avoid that the inaccuracies of the model become relevant. This may be done starting from conditions from many years, so that the average (called a 'climatology') hopefully represents a typical map for the particular month or day of the year. GISS website: FAQs
Time of day (adjusted to midnight-midnight) Homogeneity (station metadata) Incomplete Data (FILNET) Urban Heat Island – ignored Elevation Corrections to Temperature data
Population Density Study Roy Spencer, 2010
Surface stations: Instruments Anthony Watts, Meteorologist For nearly 30 years SurfaceStations.org
SurfaCE STATION: BAD EXAMPLES Temperature station at the Marysville, California fire department surrounded by heat sources. Data is shown for July 2007, only 14 of 31 days have readings.
Station: Lampasas, Texas Station moved
What is Wrong with the Science of global Warming Polar bears and polar ice
US Fish and Wildlife service 1950s – 4000 to 6000 polar bears today – 25 000 to 32 000 polar bears
Trends of the World’s 19 Subpopulations (2009) Polar bears are strong swimmers; they swim across bays or wide leads without hesitation. They can swim for several hours at a time over long distances. They've been tracked swimming continuously for 100 km (62 mi) (Stirling, 1988).
Antarctica • The Antarctic Ice Sheet • The Antarctic Ice Sheet is a thick, ancient sheet of ice with a maximum depth of nearly 3 miles or 4.6 km. In the last 50 years, this thickness has increased approximately 15 m. • The continent's average ice thickness is 7000 feet or 2.1 km. • This ice sheet contains over 5 million cubic miles (30 million cubic km) of ice. • Ice cover doubles the area of Antarctica each year -- extending the continent to approximately 30 million square miles.
Southern polar sea ice area November 30, 2011 Polar Research Group UIUC
Southern polar sea ice area November 30, 2011 Polar Research Group UIUC
Northern polar sea ice • The Arctic Ice Sheet • The Arctic Ice Sheet is a relatively thin, sheet of ice with a maximum thickness of only 20 m. • The average ice thickness is approximately 3.0 m as it floats above the 4000-m deep Arctic Ocean. The total surface area of the Arctic Ocean is 14.1 million square kilometers. • The most extensive form of ice to be found in the Arctic Ocean is sea ice. Sea ice is formed when seawater freezes. Sea ice is seasonal between about 60° N and 75° N, while it is relatively permanent above 75° N.
North Polar Ice March 11, 2010 Polar Research Group UIUC
Northern polar sea ice November 30, 2011 Polar Research Group UIUC
Sunspots http://solarscience.msfc.nasa.gov
Referring once again to the table we Greenhouse Gasses: Uncertainty
“Unless the disclosed e-mails are proved to be forgeries or adaptations, worrying implications arise for the integrity of scientific research and for the credibility of the scientific method.” Institute of Physics, March 2, 2010 The Case of the Climate e-mails In November 2009, the world got a glimpse into the communications between scientists in the UK, US, Russia, Australia, and elsewhere when someone released thousands of e-mails and documents on the internet from the period 1996 to November 12, 2009. Media (primarily newspapers) covering the story and various deniers dubbed it Climategate.
People and Places • Climate Research Unit (CRU) University of East Anglia – UK • Met Office Hadley Centre – UK • Pennsylvania State University – US • Intergovernmental Panel on Climate Change (IPCC) – UN • National Center for Atmospheric Research - US Phil Jones, CRU Keith Briffa, CRU Michael Mann, PSU Tom Wigley, NCAR Rajendra Kumar Pachauri, IPCC
Peer Review side-stepped Peer Review? In another, Jones and Mann discuss how they can pressure a peer-reviewed journal not to accept the work of climate skeptics with whom they disagree… "Perhaps we should encourage our colleagues in the climate research community to no longer submit to, or cite papers in this journal," Mann writes, We would also need to consider what we tell or request of our more reasonable colleagues who currently sit on the editorial board." "I will be emailing the journal to tell them I'm having nothing more to do with it until they rid themselves of this troublesome editor," Jones replies. Mann continued. "This was the danger of always criticising the skeptics for not publishing in the 'peer-reviewed literature'. Obviously, they found a solution to that—take over a journal!“ In one e-mail, Phil Jones writes Michael E. Mann and questions whether some published work that questions the link between human activities and global warming deserves to make it into the IPCC report... "I can't see either of these papers being in the next IPCC report," Jones writes. "Kevin and I will keep them out somehow -- even if we have to redefine what the peer-review literature is!"
Data Manipulation? Smoking Gun? In one e-mail from 1999, Phil Jones refers to one of Mann's articles in the journal Nature and writes, "I've just completed Mike's Nature trick of adding in the real temps to each series for the last 20 years (i.e., from 1981 onwards) and from 1961 for Keith's to hide the decline."
As for the ‘decline’, Keith Briffa’s maximum latewood tree ring density proxy diverges from the temperature records after 1960 (this is more commonly known as the “divergence problem” and has been discussed in the literature since Briffa et al. (Nature 391, 678-682, 1998). • The “problem” arises because Briffa reconstruction goes down from 1940 to 1994 instead of up. It doesn’t match observed temperature increases seen in instrumental data. • Jones deleted the post-1960 values of the Briffa reconstruction, replaced them with instrumental values, smoothed the spliced series and ended up with a reconstruction that looked like an accurate reconstruction of late 20th century temperatures. Hide the Decline
Data (manN)ipulation IPCC 2001 Fig 2.21 showing Briffa, Jones and Mann reconstructions together with HadCRU temperature.
Midieval warm period A literature review finds 200 peer-reviewed research articles that discuss the MWP by 660 different scientists from 385 separate institutions in 40 nations that concern worldwide data from all countries. Of those, 66 articles give quantitative data and breakdown as follows: 56 indicate MWP temperatures > today’s high temperatures 8 indicate MWP temperatures = today’s high temperatures 2 indicate MWP temperatures < today’s high temperatures The IPCC in its 2001 and 2007 chose to go along with the two papers. But in its first report… NIPCC Report (2010), p 69