Download
1 / 150
1.51k likes | 1.68k Views
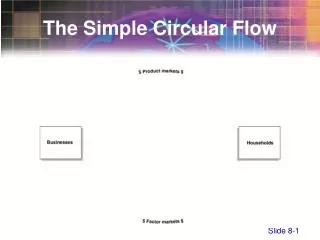
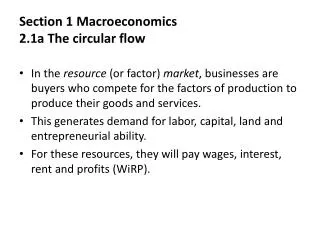
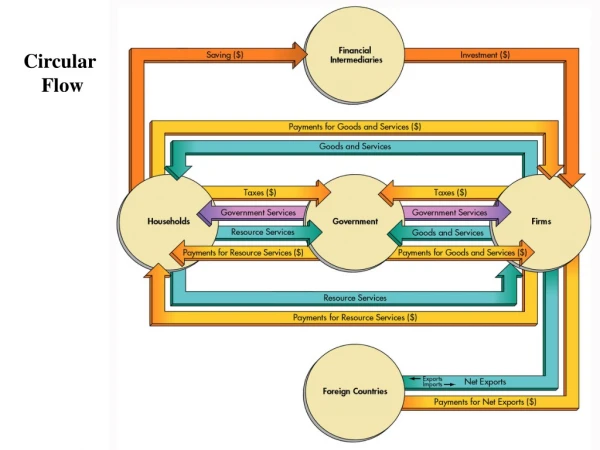
Section 1 Macroeconomics 2.1a The circular flow. In the resource (or factor) market , businesses are buyers who compete for the factors of production to produce their goods and services. This generates demand for labor, capital, land and entrepreneurial ability.

E N D
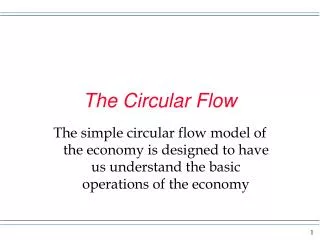
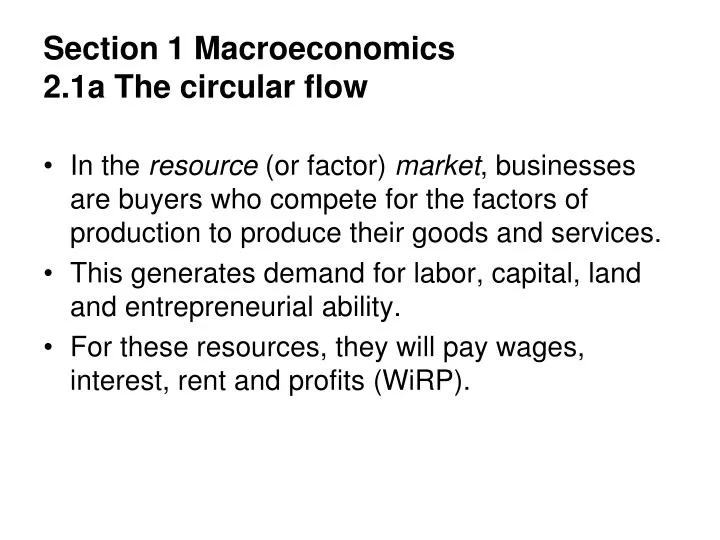
Section 1 Macroeconomics2.1a The circular flow • In the resource (or factor) market, businesses are buyers who compete for the factors of production to produce their goods and services. • This generates demand for labor, capital, land and entrepreneurial ability. • For these resources, they will pay wages, interest, rent and profits (WiRP).
Sellers of resources (households) will try to maximize their income by selling their factors to the highest bidder. For example, a worker with scarce skills will be able to sell their labor for a higher wage than a less qualified competitor. With their incomes, the sellers of resources will turn to the product market to spend their earnings on goods and services.
Circular Flow Diagrams are the simplest models for understanding how a macro-economy works. This relatively simple example shows how aggregate income levels are exchanged for resources—including labor—that are bought from households. Income, in turn, gets spent on goods and services, repaying firms for the money spent on resources.
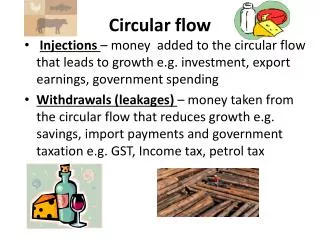
Sophisticated circular flow models include leakages and injections into the macroeconomy. The relative size of each leakage or injection can have a large impact upon the economy’s final output. Leakages and injections must equal each other and therefore can be presented as follows:
One implication of the model is that the values of each flow are equal. • Since resource expenditure is funded by consumer spending, they must be equal, and the total value of production must be the same as well.
2.1b Measuring national income • There are two distinct methods of measuring the total output of an economy. • Gross Domestic Product (GDP) • Gross National Product (GNP)
GDP is the total money value of all goods and services produced in an economy over a certain time, usually one year. GDP includes the output of foreign firms in a country, but does not include the output of domestic firms overseas. This figure is based on geographic boundaries.
GNP is the total money value of all goods and services produced by the citizens or firms of a particular country, no matter where they are based, but does not include the production of foreign firms within the country. This figure is based on nationality/citizenship of the owner of the property or labor.
Net Domestic Product (NDP) is Gross Domestic Product less depreciation, and depreciation is the value of capital that is used-up in production and must be replaced. GDP = NDP + depreciation
Another important distinction is that of Nominal GDP vs. REAL GDP. Nominal GDP can exaggerate the true value of production because it measures output at current prices. If there is significant inflation, any change in GDP will be greater than the real change in output.
REAL GDP measures output with a single year’s prices, what is called a base year. GDP is useful in discerning a broad picture of the relative size of economies and making general comparisons between countries.
Another valuable measure is called Per Capita GDP, which is a better measure of, on average, how wealthy people are in different countries. Per Capita GDP = GDP ÷ population
GDP as a measurement has several shortcomings, one of which was just noted (income distribution). A. GDP also does not take into account qualitative changes in the output of goods and services. We know that electronics that have been developed recently have many more features than those just 5 years old. GDP does not take into consideration this advance in technology.
B. GDP does not take into account informal or black market activities. Consequently, the babysitting that you provided to your neighbor last weekend is not counted in the GDP. Nor are illegal activities such as selling stolen goods counted. C. Do it yourself activities are not counted in the GDP. The work of stay at home parents around their house nor is the shed built by your dad last summer included in GDP.
D. Used or second hand goods are not counted as they were already calculated in the GDP the year they were originally manufactured. E. Purely financial transactions such as stock market transactions or transfer payments between the government and citizens or family gifting of cash (such as at holiday or graduation time).
F. In developing countries, most citizens are engaged in informal subsistence economic activities, which are not in the formal economy and therefore not counted in the GDP figures.
Finally, GDP does not take into account negative externalities that are produced as a result of economic activity. The green GDP, which has been attempted by several countries, is meant to measure the output of goods and services while subtracting the “bads” of environmental destruction.
There two primary methods of calculating GDP: Income method = adding up all of the money incomes generated by the owners of the factors of production (or WiRP) of a given economy for a given accounting period. Expenditure method = compiling all of the expenditures on final goods and services within an economy for a given accounting period.
The income approach to GDP accounting is demonstrated from the data for the U.S. economy in the first quarter of 2012 shown below:
Note several interesting elements of the methodology: Taxes on Production and Imports: This is basically an adjustment to take into account indirect taxes (i.e. business property, sales and excise taxes) that find their way into transactions but are not really counted in the WiRP figure.
Consumption of Fixed Capital: Essentially this is value of depreciated capital that has been replaced as a cost of production, which is not counted as income. As the money is not available for other uses, it does not show up in anybody’s income. This category is an accounting method to balance the GDP in the income method with the expenditure method.
The most common method of GDP accounting though is the expenditure method. It is broken down as follows: • Consumption (C): Personal household expenditures on goods and services. This includes everything from food to utilities to rent to clothing to cars to school supplies. Services are things like hair styling, doctors, auto repair and banking.
Investment (I): Gross private investment in physical plant, machinery, construction and inventories. This includes replacement investment of worn out machinery or buildings. This figure does not include paper assets (stocks and bonds) as these are mere changes in ownership rather than the creation of new productive capacity.
Government expenditures (G): Government purchases includes expenditures on goods and services used in providing public services as well as spending on schools and highways which might not be used up in a year.
Net exports (X-M): Exports are goods and services, which are developed within an economy and sold abroad to consumer from other countries. In the expenditure method these are an injection, yet imports (our country’s purchases of foreign made goods and services) are a leakage. Therefore, we take the net effect of these transactions and include that figure in the final GDP figure.
All of this can be put together as a simple equation: C + I + G +(X – M) = GDP This equation also happens to be the equation for Aggregate Demand (AD) which will become a useful tool for you in future sections when discussing how different policies impact economic output.
Here is an example from the first quarter of 2012 in the U.S. economy.
2.1c The business cycle • Most economies experience a long run upward trend in economic growth partially due to the increase in population and improvements in productivity.
Potential output is represented as a trend line of growth. Potential output is the output of the economy if all factors of production are fully employed in their highest and best use. However, the actual growth of the economy is not always a straight line and there are often periods of instability or recession.
There are four phases most commonly referred to in business cycle theory. Peak – When an economy has reached its maximum output with the performance being at or near full employment or the economy’s capacity. This is characterized by a shortage of skilled labor and materials, which puts upward pressure on prices. Companies are making solid profits and optimism is high.
Recession – Indicates a period of decreasing total output and other measurements. A recession can be a point at which consumers and firms have exhausted their consumption or investment budgets. This usually lasts at least 6 months and is associated with contractions in employment and business activity. Unemployment rates usually rise during these periods
Trough – The bottom of a recession. This is associated with high rates of unemployed labor and productive capacity. Corporate profits are low and pessimism is high.
Recovery – Sometimes called an expansion. Economies cannot stay in a trough forever as machinery wears out and firms have to start to replace capital. Price levels may have fallen low enough to induce new investment in inventories or new consumption as consumers may be tired of not buying. GDP growth and employment increase off the bottom of the trough as the economy expands.
Some of these periods are also associated with what are called output gaps. • If the gap is negative (Y < Yfe), then it is referred to as a recessionary gap • If the gap is positive (Y>Yfe), then it is referred to as an inflationary gap as we have gone beyond full employment. • Let’s look at a diagram.
As the diagram makes clear, the inflationary gaps occur when the economy is peaking or growing faster than the trend line of growth. • The recessionary gaps are apparent when economic growth dips below the trend line or potential output of the economy.
2.2a Aggregate Demand • Aggregate demand (AD) is comprised of all the spending that comes to a domestic market. Aggregate demand, is a schedule, which shows the amounts of real GDP that buyers will collectively buy at given average price levels in the economy.
Therefore we categorize the different types of demand like this: • Consumer spending (C) • Investment (I) • Government spending (G) • Net Exports (X – M)
The aggregate demand curve has a negative slope. Essentially the AD curve is the visual representation of the expenditure method of GDP accounting. • The price level is measured as the average price level of final goods and services (product) in the economy and is considered a measurement of inflation.
Why is the AD curve negatively sloped? • The first reason is called the real balances effect. As the price level rises, the purchasing power of the public’s income or savings decreases so they can buy less as the price level rises. This factor is most closely associated with consumption (C).
Secondly, the interest rate effect influences the slope. As prices rise, there is an increase in demand for money and the cost of borrowing money (the interest rate) will rise as well. Lenders will charge a higher rate of interest for the public to borrow money to finance household consumption or for firms to invest in productive capacity. This effect is usually most visible in investment (I).
Finally there is the foreign purchases effect. When the price level rises, it makes the country’s exports more expensive to foreign buyers. This leads to a decrease in foreign purchases of the country’s exports. Moreover, rising domestic prices may make imported goods cheaper and result in citizens substituting imports for exports at higher price levels. This is effect is seen in net exports (X – M).
In the diagram above, the economy is producing output Y at the price level P. • Shifts in the AD curve are the result of changes in the components of AD or changes in the factors of the following equation: C + I +G + (X – M) = AD
Consumption – The elements that affect consumer spending would be changes in the following: Consumer wealth – While changes in income will clearly change consumption, so will the wealth of households. If there is a change in the value of physical (real estate) or paper (stocks and bonds) assets, then consumers will feel more or less wealthy and adjust their spending accordingly.
Consumer expectations – If consumers believe that their real income will change in the future, they will increase or reduce expenditures based upon their expectations. • Personal income taxes – A direct tax will affect disposable income which will have an impact upon households ability to consume.