Download
1 / 55
600 likes | 900 Views
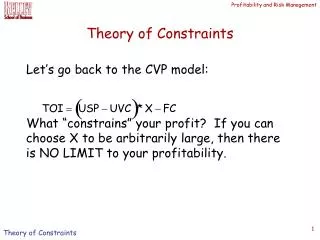
The Theory of Constraints. Eli Goldratt, a physicist. OPT: a scheduling package. The Goal and the Theory of Constraints. TOC provides a way of thinking globally. Goldratt challenges the conventional approach to managing organizations. Traditional Decision Making.

E N D
The Theory of Constraints • Eli Goldratt, a physicist. • OPT: a scheduling package. • The Goal and the Theory of Constraints. • TOC provides a way of thinking globally. • Goldratt challenges the conventional approach to managing organizations.
Traditional Decision Making The “Cost World” Perspective
Traditional Decision Making • How are investment decisions usually made? • Usually based on cost considerations (right)? • “The Cost-World” Perspective • Consider how the cost-world perspective affects the push towards parts per million (PPM) quality and “Zero” inventory.
The Cost World Perspective: Cost and PPM Quality $60,000 $20,000 Do It! 8% 2% $15,000 $20,000 Maybe? 2% 0.5% Do NOT Do $4,000 $20,000 0.5% 0.1%
I’ll do better next time! No problem. Everything is OK! Is 99.5% Quality Good Enough For You? If it is, then you won’t mind if: • Doctors in New York State hospitals drop 1,291 babies per year • Post Offices in New York State lose 9,315 pieces of mail per day • Chicago O’Hare International Airport has 4,197 unsafe arrivals / departures per year
The Cost World Perspective: Cost and Inventory Turns Do It Maybe? Do NOT Do * Assuming starting inventory of $15M and 25% carrying cost
The Real Cost of Inventory • Inventory adversely affects all the factors that give you a competitive edge (namely, Price, Quality, and Delivery). Higher inventory leads to: • Longer lead times and poorer delivery performance, • Defects not being detected soon enough, • Increased costs due to obsolescence, storage costs, overtime, etc.
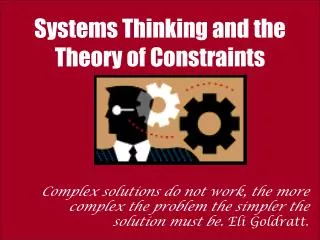
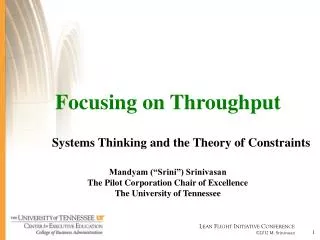
Systems Thinking and the Theory of Constraints The “Throughput World” Perspective
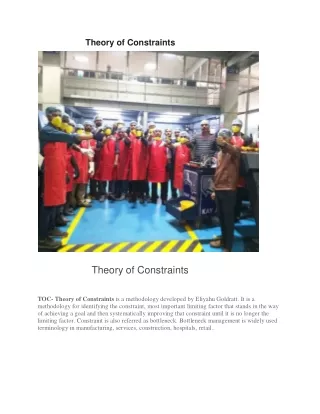
The Theory of Constraints • The Theory of Constraints (TOC) is based on two premises: • The Goal of a business is to make more money, … in the present and in the future. • A system’s constraint(s) determine its output.
TOC Performance Measures • Throughput (T): The rate at which the system generates money through sales. • Inventory (I): All the money invested in purchasing things needed by the system to sell its products. • Operating Expenses (OE): All the money the system spends, turning inventory into throughput.
The Goal: To Make Money • Bottom Line Measurements NET PROFIT (Absolute) RETURN ONINVESTMENT (Relative) CASH FLOW (Survival)
The Theory of Constraints The Five-Step Focusing Process
The Throughput World: The Five Step Focusing Process of TOC • Step 1: Identify the System’s Constraint(s) • Step 2: Decide how to Exploit the System’s Constraints • Step 3: Subordinate Everything Else to that Decision • Step 4: Elevate the System’s Constraints • Step 5: If a Constraint Was Broken in Previous Steps, Go to Step 1
Types of Constraints • Physical Constraints • Physical, tangible; easy to recognize as constraint. Machine capacity, material availability, space availability, etc. • Market Constraints • Demand for company’s products and services is less than capacity of organization, or not in desired proportion. • Policy Constraints • Not physical in nature. Includes entire system of measures and methods and even mindset that governs the strategic and tactical decisions of the company.
Policy Constraints • Mindset Constraints • A constraint if thought process or culture of the organization blocks design & implementation of measures & methods required to achieve goals • Measures Constraints • A constraint if the measurement system drive behaviors that are incongruous with organizational goals • Methods Constraints • A constraint when procedures and techniques used result in actions incompatible with goals
Effect of Performance Measures “Tell me how you will measure me and I will tell you how I will behave.” “If you measure me in an illogical way, … do not complain about illogical behavior.”
Effect of Performance Measures “If you measure me in an unreasonable way, no one knows how I will behave...”. “Not even me.”
Identifying Constraints • Identifying Physical Constraints: • A Typical WIP Inventory Profile: Ave. WIP Inventory R1 R2 R3 R4 R5 R6
How can we get the most from Physical Constraints? • Techniques for getting the most from capacity constraints: • Eliminate periods of idle time • Reduce setup time and run time per unit • Improve quality control • Purchase additional capacity • Is there anything else we can do?
Do We Shut The Plant Down? • Is this a “throughput world” perspective? • We dealt with “product profits.” Are there any product profits in the throughput world? • What is the second focusing step? • DECIDE HOW TO EXPLOIT THE CONSTRAINT.
Throughput World vs. Cost World • The throughput world perspective indicates that we should first focus on producing product . P • The cost world perspective had indicated that we should first focus on producing product. Q
Which Perspective Is Correct? • Produce P first: 100 / week. Requires minutes of B. Leaves minutes to make Q. • Each Q requires minutes on resource B. Can produce units of Q. • With 100 units of P and units of Q, we get 100 x $45 + x $60 = $ each week. • After subtracting $6,000 for operating expenses, we obtain a net profit of 1500 900 30 900/30 = 30 30 6300 30 $300
Cost World or Throughput World? • What product will you focus on? P “Yes, there are two paths you can go by, … But in the long run, There’s still time to change the road you’re on.”
The 5 Focusing Steps (Contd.) • What is Step 4? • Elevate the System’s Constraints • How does it affect us here? • The Marketing Director Speaks Up : • “Another constraint in our company.” • It is the market • A Great Market in Japan! • “Have to discount prices by 20%”
Maybe We Should Not Sell in Japan? 2 • Right now, we can get at least $ per constraint minute in the domestic market. • So, should we go to Japan at all? Perhaps not. • Okay, suppose we do not go to Japan • Is there something else we can do? • Let’s buy another machine! Which one? B • Cost of the machine = $100,000. • Cost of operator: $400 per week. • What is weekly operating expense now? $6,400 • How soon do we recover investment?
The Paradise Plant! IF: Clients never change their mind, Vendors always supply what we ask for, on time, Our workers are excellently trained, Our processes are extremely reliable, Our quality is superb, We do not have any absenteeism, Data is readily available and accurate, and You can decide on whatever policies you want. THEN: Managing production will be a piece of cake, … right?
The Paradise Plant! The Simulator provided you with a paradise plant because all external causes were eliminated. Nevertheless, Was it easy to manage production?
Rethinking Project Management The Critical Chain
Generally a “one-off” type of activity Typically involves completing a set of tasks Tasks typically have long durations that are also highly variable Project Management: Characteristics
Project Management: Problems Usually Faced • Project is not clearly defined • “Known Work” + “Known Unknown Work” + “Unknown Work” • Existing project work is not complete before new projects shift priorities leading to multi-tasking • Problems in a project cascade into another project • Constant pressure to increase staff for peak loads • A lot of uncertainty involved in estimating task durations
Task 1 Task 2 5 25 Managing Projects Under Uncertainty • First, consider a simple project with 2 tasks performed by 2 different operators: Assume task durations are uniformly distributed (5,25) If each task takes 15 days on average, what is average project completion time? 30 days
Task 1 Task 3 Task 2 5 25 Managing Projects Under Uncertainty • What else makes project management complex? • Consider a slightly more complex project: Assume task durations are uniformly distributed (5,25) As before, each task takes 15 days on average. What is the average project completion time? 33 days Probability of completing project in 30 days? 36%
Task 1 Task 3 Task 5 Task 2 Task 4 5 25 Managing Projects • The affect of resource interdependencies on a simple project: If each task takes 15 days on average, what is the probability that the project finishes in 45 days? Srini; Here we get about 30% < 25%
Determining Task Durations • Conclusion: A project’s most likely completion time is much larger than the sum of the averages of the tasks making up it’s longest path (due to synchronization or due to task dependencies) • So, how do we quote estimated completion time of the project? • Do people give a number that they know has a high (50% or more) chance of missing?
5 25 Determining Task and Project Durations – the Traditional Way Task 1 Task 3 Task 5 Task 2 Task 4 So, the average task times are “padded” to accommodate any possible delays. Instead of specifying a 50% time estimate (which fails half the time), a 98% confidence estimate is developed for the tasks and project duration. The project is now estimated to take 70 days, not 45. What is the chance the project will complete in 70 days? Srini 98% of [5,25] = 5+.98*20 = 5+19.6 = 24.6
Project Management - The Traditional Way • A network is drawn up, representing tasks, and precedence relationships between tasks • The task durations are buffered to accommodate uncertainty surrounding the tasks. • Milestones (due dates) are developed for each task. • The Critical Path is determined. • The padded project duration (with safety buffers) is conveyed to the customer and to supervisors • The project is monitored. • So, why is it very unlikely that the project will complete on time?
Project Management The TOC Way The Genesis of the Critical Chain
Theory of Constraints and the Critical Chain • Eli Goldratt, a physicist. • The Goal (1982, 3rd edition published 2004) • The Critical Chain (1997) • Goldratt challenges the conventional approach to managing organizations. • TOC tools for • Production: Drum-Buffer-Rope • Project Management: Critical Chain
Managing the Critical Chain The Critical Chain implementation begins with 3 questions: • What to change? • What to change to? • How to cause the change?
What to Change? • Erroneous assumptions: • It is good to induct work as soon as possible • Protecting task times with buffers will improve on-time performance (this is a biggie) • Multitasking is beneficial • Providing milestones for each task is good • …
What to Change: Behavioral Effects • Parkinson’s Law: “Work expands to fill the time available.” People tend to continue working on a task that could have been completed earlier if they are given a pre-specified completion time. • The Continue to Polish syndrome (aka: the 3-Minute Egg Rule): “It’s not quality if it’s finished before time is up.” • The Student Syndrome: When people feel there is plenty of time to complete a task, other things become important and they procrastinate on the task.
Behavioral Effects: The Student Syndrome 100% 75% Percent of Project Completed 50% Completion Date 25% Time Elapsed Project Due Date
More Behavioral Effects that Increase Task and Project Durations • People do not want to hurt their future negotiating power by finishing too soon. • There is a sense of urgency, promoting a tendency to induct work as soon as possible.
Cascade effect within & • across projects • Pressure to deliver on time • Pressure to expedite • Multi-tasking • Priority changes • De-synchronization • Induct Asset ASAP • Start repairs ASAP • Start buildup ASAP • Expediting • Multi-tasking • De-synchronization • Early release for • production • Push parts to Back shops ASAP • Pull parts from Back shops ASAP Losing Time & Capacity Due to Uncertainties, & by Inducting ASAP: An MRO Example Uncertainties multiply Delays Intrinsic Uncertainties Start Early (CT ) Lines High no. of jobs in progress Delays/ Shortages Lead time Resource contention (Queues ) Backshops ãRealization Technologies, Inc.
Summary: Sources of Project Delays • A. Synchronization Delays • Integration (assembly) points • Resources and tasks • B. Delays due to Behavioral Effects • Parkinson’s Law • “Student” Syndrome • “Continue to Polish” Syndrome • C. Queuing Delays • Induct work ahead of schedule • Multitasking ãRealization Technologies, Inc.
The Affect of Multitasking • 3 Tasks, A, B, C, each of duration 6 days, that have to be executed by one resource. • How should you schedule these tasks? A2 B2 C2 A2 B2 C2 A2 B2 C2 Lead Time for Task A? A6 B6 C6 Lead Time for Task A?
What to Change to? • Project Planning (aka Network Building): A meeting of project stakeholders for clarity on intended objectives and success criteria (how to deliver on the order winners) • Identify resource dependencies • Capture time estimates – and build the right safety net – determine “Aggressive But Possible” times
What to Change To? • Identify the longest path of dependent events. This is the Critical Chain • Put in place Project Buffer and Feeding Buffers • Avoid displaying milestones (EST, EFT, LST, LFT). • Rather, emphasize the “Relay Runner” work ethic (this is a biggie).
What to Change to? The Rules of the Critical Chain: • Do not schedule Project tasks/ resources precisely at planning time. • Pipelining: Do not start projects ASAP. • Allow explicit buffer time in projects. ãRealization Technologies, Inc.