Download
1 / 41
410 likes | 537 Views
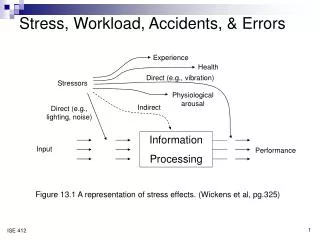
13. Stress and Workload. stressors environmental – noise, vibration, heat, light psychological – anxiety, fatigue, frustration, anger four effects – direct or indirect ( fig 13.1 ) psychological experience – frustration or arousal change in physiology

E N D
13. Stress and Workload • stressors • environmental – noise, vibration, heat, light • psychological – anxiety, fatigue, frustration, anger • four effects – direct or indirect (fig 13.1) • psychological experience – frustration or arousal • change in physiology • affect the efficiency of information processing – not always degrading • long-term negative consequences for health • ENVIRONMENTAL STRESSORS • Motion High-Frequency Vibration • high frequency; specific limb or whole body • vibrating white finger syndrome – excessive continuous levels of high-frequency vibration • full-body vibration – not well documented; eye-hand coordination, visual task Low-Frequency Vibration and Motion Sickness • lower frequency • decoupling between the visual and vestibular inputs • Thermal Stress • performance degradation and health problems
comfort zone • 73°F to 79°F (23 - 26°C) in summer and 68°F to 75°F (20 - 24°C) in winter • skewed -- less humidity is allowed (60%) at the upper temperature limit of 79°F than lower limit of 68°F (85% humidity allowed) • heat stress – performance degradation on perceptual motor task (tracking and RT); indirect – the efficiency of information processing not the quality • long-term consequences – dehydration, heat stroke, heat exhaustion • heat (and humidity) influencing variables • clothing worn, air movement, the degree of physical work (metabolic activity) • cold stress – frostbite, hypothermia, health endangerment – disruption of coordinated motor performance • Air Quality • poor air quality or pollution by smog and carbon monoxide; anoxia • PSYCHOLOGICAL STRESSORS • Cognitive Appraisal • differences in cognitive appraisal • may fail to perceive the circumstances of risk • may fail to understand the risk • relatively more confident or even overconfident • reference in control
Level of Arousal • anxiety and danger increase in physiological arousal – HR, pupil diameter, hormonal chemistry • inverted U function of performance (Yerkes-Dodson Law) • trying harder, OLA, overarousal • criticized because it never specify exactly where the OLA is (fig 13.2) • Performance Changes with Overarousal • perceptual or attentional narrowing (tunneling) – cognitive tunneling • working memory loss while LTM little hampered, even be enhanced • strategy shifts – “do something now” -- speed-accuracy tradeoff • Remediation of Psychological Stress • simplification – design of displays, controls, procedures • actions should be explicitly instructed; as compatible as possible with conventional, well-learned patterns of actions and compatible mapping of displays to controls – knowledgein the world • auditory alert and warnings – avoid excessively loud and stressful noise • training • extensive (excessive) training of emergency procedures – LTM • generic training of emergency stress management – guidelines (inhibiting the tendency to respond immediately), breathing control to reduce the level of arousal
LIFE STRESS • financial difficulties, labor-management relations, stressful life events • lack of attention (low motivation), distraction or diversion of attention • WORKLOAD OVERLOAD The Time-Line Model • workload – a ratio of time required to time available (TR/TA) – fig. 13.3 • predict how much workload a human experiences • predict the extent to which performance will suffer because of overload • as the ratio increases, the experience of workload also increases relatively continuously • human performance decrement due to overload occur at or around TR/TA=1 spare capacity region and overload region – fig. 13 - 4 • four challenging factors to workload estimates • identification of task times (coverttime) 2. scheduling and prioritization 3. task resource demands and automaticity 4. multiple resources Workload Overload Consequences • important consequences for human performance in the overload region something is likely to suffer • Edland and Svenson (1993) more selectivity of input, more important sources of info given more weight, decrease in accuracy, decreasing use of heavy mental computations, lockingonto a single strategy Remediations • task redesign – automation, display design • training on the component tasks, task management skills, calibration on tasks
Mental Workload Measurement • mental workload by the ratio of the resources required to the resources available Primary Task Measures • measures of system performance on the task of interest – the speed and accuracy • Not really a workload measure per se but influenced by workload (reflect workload) Secondary Task Methods • measures reserve capacity • Available resources – time estimation, memory task, mental arithmetic, etc. • problematic because artificial, intrusive, or both embedded secondary task Physiological Measures • HR variability – mental workload • Blink rate, pupil diameter, electroencepholography (EEG) Subjective Measures – NASA Task Load Index (TLX) • Do notalways coincide with their performance Workload Dissociations • multiple measures are recommended • FATIGUE AND SLEEP DISRUPTION • high mental workload performance may degrade • Fatigue – a transition state between alertness and somnolence • A state of muscles and the central nervous system in which prolonged physical activity or mental processing, in the absence of sufficient rest, leads to insufficient capacity or energy to maintain the original level of activity and/or processing • Fatigue not only from the accumulated effects of doing too much work, but also from prolonged periods of doing very little (vigilance)
Vigilance and Underarousal Causes of the Vigilance Decrement • Signal detection theory (hits, correct rejections, misses, false alarms) – the increased number of misses • time – the longer , the more misses • event salience • signal rate – low signal expectancy (more conservative, more misses and fewer false alarms) • arousal level Vigilance Remediations • frequent rest break • more salient signal (signal enhancement) • payoffs or changing the signal expectancy (false signals) • Sustain a higher level of arousal – frequent rest breaks, external stimulation (music, noise) • Not sleep deprived • Sleep Disruption • major contributor to fatigue – sleep deprivation (loss); circadian rhythm; jet lag or shift work • Sleep Deprivation and Performance Effects • Tasks sensitive to sleep disruption – decision making, innovation and creativity, learning or storing new material, self-initiated cognitive activity • long-duration missions lasting more than a day (military combat missions or long-haul truck driving, or an airline pilot’s trip) • the quality of sleep typically less, so a sleep debt built up • less than adequate amount of sleep the night prior to the mission
Circadian Rhythms • body temperature (fig. 13.5) – min. in the early morning and max in the late afternoon/early evening • Sleepiness (sleep latency test), sleep duration, performance • Circadian Disruption Jet Lag • west bound (delayed shift) – adapt more rapidly, less sleep disruption Shift Work • assign permanently to different shifts – never fully adapted, smaller pool of owls • a fairly continuous rotation of shifts • alter the shift periods but to do so relatively infrequently • delayed shifts are more effective than advanced shifts • Longer shift • Remediation to Sleep Disruption • get more sleep, napping, sleep inertia, sleep credits, sleep management
14. Safety and Accident Prevention • Product Liability • Injuries or death occurs in the workplace or elsewhere • Product was somehow defective, and the defect caused injuries or death • Design defective (inherently unsafe) • Manufacturing defect • Warning defect • Defective when it “failed to perform safely as an ordinary user would expect when it was used in an intended or reasonably foreseeable manner, or if the risks inherent in the design outweighed the benefits of that design • FACTORS THAT CAUSE OR CONTRIBUTE TO ACCIDENTS • Systems approach • accidents occur because of the interaction between system components (fig. 14.1) • task performance -- employee-task-equipment • Social/psychological factors – social norms • Environmental factors – heat, noise (Table 14.1) • Personnel Characteristics (Fig 14.2) Age and Gender • the most predictive factor is age (15 – 24, peak at 25) • Physical and cognitive abilities – up for the elderly
Job Experience • 70% of accidents within first 3 yrs, peak at about 2 – 3 months Stress, Fatigue, Drugs, and Alcohol • personality factors – accident prone • Job characteristics • high physical workload, high mental workload, other stress-inducing factors • long work cycles and shift rotation – increase fatigue level • Equipment Controls and Displays Electrical Hazards Mechanical Hazards Pressure and Toxic Substance Hazards • The Physical Environment Illumination Noise and Vibration Temperature and Humidity Fire Hazards Radiation Hazards Falls Exits and Emergency Evacuation
The Social Environment • management practices, social norms, morale, training, incentive • Human Error • Inappropriate human behavior that lowers levels of system effectiveness or safety Error Classification • errors of commission – does something that should not have been done • errors of omission -- fail to do something that should have been done • Intended error • mistakes – the inappropriate action was intended (Norman, 1981) • Reason (1990) – knowledge-based mistakes and rule-based mistakes • violation – intentionally does something inappropriate – emphasis on productivity over safety and inadequate safety culture • Unintended error • slip – intention is correct but the execution is incorrect (commission errors) • lapses – nonintentional errorswith omission – failure of prospective memory Errors and System Safety • resident pathogens – an accident waiting to happen – safety culture • hindsight bias or “Monday morning quarterbacking” Error Remediation • error containment embodied in the design of error-tolerant systems good feedback, give “a second chance”
HAZARD IDENTIFICATION AND CONTROL • Hazard Criticality and Risk • criticality – synonymous with risk, combination of the probability and severity • probability – frequent, probable, occasional, remote, improbable • severity – catastrophic (death or loss of a system), critical (severe injury or major damage), marginal (minor injury or minor system damage), negligible (no injury or system damage) • Hazard Identification Preliminary Hazards Analysis • early in the conceptual design phase • a list of the most obvious hazards among task actions, potential users, and environments cause and effect estimate the likelihood, severityof consequences potential corrective measures Failure Modes and Effects Criticality Analysis (FMECA) • an extension of FMEA, the hazards associated with physical components of a system • system subassemblies constituent components failure modes effects on other components and subassemblies (hazard as well as human error) • Extent to analysis of the human system (operator performance) – table 14.4 Fault Tree Analysis • top down from an accident to possible causes with Boolean AND/OR logic • Powerful method for hazard identification – fig. 14.3
Hazard Controls • safety analysis -- develop a list of hazard controls • Hazards -- criticality – controls (cost-benefit trade-offs) – relative advantage/disadvantage column – recommended control column • the best hazard reduction – eliminate it at once (designing out a hazard source, functionality) providing a barrier or safeguard (path) changing the behavior (warning and training workers) administrative procedures or legislation (administrative control) • SAFETY MANAGEMENT • Safety Programs • employee involvement makes a significant difference in the effectiveness of a safety program Identify Risks • document analysis interviews facility walk-through a list of hazards • Reactive and proactive approach • job safety analysis • the heavy involvement of employees, long-term benefits, efficiency, ergonomic factors Implementing Safety Programs • the most effective means after design and guarding methods • participatory approach, training, feedbacks and incentives Measuring Program Effectiveness
RISK-TAKING AND WARNINGS • Risk-Taking as a Decision Process • thechoicebetween safe and unsafe behavior is initially knowledge based decision process to rule based or simply automatic • Diagnosis generation of alternative actions evaluate alternative actions decision based on simplifying heuristics (satisfying) • three psychological components affecting safe behavior • perceived severity of the hazard/injury • the novelty of the hazard and whether exposure was voluntary • familiarity • Choice to act safely action selection process as involving two cognitive stage • risk perception – availability of risk in memory • action choice -- cost of compliances • Written Warnings and Warning Labels • warnings are the easiest and cheapest means of protecting from product liability suits • signal word (danger, warning, or caution), description of the hazard, consequences associated with the hazard, behavior needed to avoid the hazard • gaining a person’s attention – bright orange • legible font size, contrast, short and simple text, easily interpreted pictures and icons • compliance by administrative controls and enforcement
15. Human-Computer Interaction • THE TROUBLE WITH COMPUTERS AND SOFTWARE DESIGN • increased computer technology does not guarantee increased productivity • well-designed software interface impact on learning time, performance speed, error rate, and user satisfaction • Design Criteria for Usable Software • efficiency, accuracy, learnability, memorability and satisfaction • SOFTWARE DESIGN CYCLE: UNDERSTAND, DESIGN AND EVALUATE (Fig15.1) • user-centered design, participatory design, iterative design • UNDERSTAND SYSTEM AND USER CHARACTERISTICS • creeping featurism, balance between functionality and ease of use • the frequency of task performance using the particular software – efficiencyover memorability • mandatory versus discretionary use – ease of use vs. ease of learning and remembering • the knowledge level of the user • novice users – ease of learning, low reliance on memory – “walk up and use”, GUI (recognition over recall) • knowledgeable intermittent users – reducing the load on memory, adaptive interface • expert frequent users (efficiency and accuracy)
DESIGN USING THEORIES AND MODELS • Seven Stages of Action • gulf of execution – the mismatch between the user’s intentions and the actions supported by the software – good, well-human factored controls • gulf of evaluation – the mismatch between the user’s expectations and the system state – food, dynamic info in interpretable displays • Models of User Performance for Design: GOMS • goals, operators, methods, selection rules • detailed description of user tasks and specific quantitative predictions • explicitly identify and list user’s goals and subgoals • identify all of the alternative methods that could be used for achieving goal/subgoal • write selection rules • DESIGN TO SUPPORT MENTAL MODELS WITH CONCEPTUAL MODELS AND METAPHORS • conceptual model – the general conceptual framework through which the functionality is presented • making invisible parts and processes visible to user • providing feedback • building in consistency • presenting functionality through a familiar metaphor
DESIGN USING PRINCIPLES AND GUIDELINES • General Usability Guidelines • general usability principles – table 15.1 • Basic Screen Design • Mayhew (1992) - general layout, text, numbers, coding techniques, color • Dialog Styles Menus • pull down or multiple hierarchical menus • should be used as a dialog style with negative attitudes, low motivation, poor typing skills, little computer or task experience • each menu should be limited to between four and six items – increased by grouping into categories and separating them with a simple dividing line • ‘broader & shallow’ vs. ‘narrow & deep’ Fill-in Forms • negative to neutral attitude, low motivation, little system experience but good typist and be familiar with the task Question-Answer • negative attitude, low motivation, little system experience, relatively good typing skills • tasks for low frequency of use, discretionary use, and low importance
Command Languages • positive attitude, high motivation, medium- to high-level typing skills, high computer literacy, and high task-application experience Function Keys • declining; frequent users who want speeds with low-level typing skills Direct Manipulation • map well onto a user’s mental model, easy to remember, no typing skills • negative to moderate attitude, low motivation, low-level typing skills, moderate to high task experience Natural Language • DESIGN OF USER SUPPORT • Software Manuals • should have well-designed, task-oriented, search tools • search words based on their goals and tasks, not on system components or names • standard human factors principles and guidelines (table 15.2) • Online Help Systems • search effectiveness and efficiency is a general difficulty • Egan and colleagues (1989) – 50% longer search time than a hardcopy manual • EVALUATE WITH USABILITY HEURISTICS • less expensive and less time consuming than UT • identifies the most relevant interface design principles and guidelines – 2 to 4 experts
EVALUATE WITH USABILITY TESTS AND METRICS • Prototypes • low fidelity methods – index cards, stickies, paper and pen drawings, storyboards • faster, easier, can be modified easily during UT • more willing to change or discard ideas • more substantive feedback to the functionality of prototypes • high fidelity methods include fully interactive screens with the look and feel • Usability Metrics • in the conceptual design phase qualitative assessment of general usability and user satisfaction (low fidelity prototypes) • later stages of UT quantitative measures (table 15.3) fully functioning prototype • think aloud, interviews, observations • what was observed and why such behavior was observed • Number of Users and Data Interpretation • not a research experiment – less concerned with large sample size 5 to 6 • Pitfalls of Usability Testing • understanding the users and their tasks • fixation on the laboratory environment
INFORMATION TECHNOLOGY • Hypertext, Hypermedia, and the Internet • hypertext – linking chunks of information (nodes) in a network • weblication – software delivered as a service over the Web • Information Database Access • four types of search • the user knows a precise label for a piece of information to be retrieved • the user knows some general characteristics of the desired item but can identify when he/she sees it • the user wants to learn what exists in the database that may be of interest • the user simply wants to understand the overall structure of the database Mediated Retrieval • direct retrieval systems – label the index or keyword terms due to standard conventions • for multiple classes of users – multiple routes to access the same entities keyword searches are not always satisfactory • difficult to specify the queries or combinations of keywords • users are not always fully satisfied with the keyword search results Intelligent Agents • a helper acts as an interface agent between the user and the information database • provide expert assistant to users
Spatially Organized Databases • rely on spatial representation of the information space to support search processes • navigation or travel through information space rather than direct retrieval spatially organized databases based on similarity (proximity) • benefits • layout principles of relatedness and sequence of use • better understand the full structure of the database by examining a broad map of its elements • should be allowed an option to “recover” • provide a historical record, bookmarks • costs • getting lost – (1) consistent with user’s mental model, (2) overall map of the space • update rate -- complex graphics, delayed travel time • Virtual and Augmented Reality • VR interface for full immersion • negative effects of delayed updates • Affective Computing • people with similar personality characteristics will be attracted to each other • the role of trust in Internet-based interactions – “real world feel” (speed of response, listing a physical address, photos of the organization