Download
1 / 37
370 likes | 482 Views
This paper explores the modeling of multiple risk factors in condition-based maintenance (CBM) and the implications of using additional condition data to enhance decision-making. By employing advanced statistical models, including the Proportional Hazards and Extended Weibull methodologies, we analyze event data from various monitoring systems. The focus is on formulating optimal CBM policies that take into account not only inspection intervals but also the physical state of equipment. Empirical examples illustrate the impact of precision modeling on financial outcomes and operational efficiency.

E N D
Parameters Condition data values at time t Proportional Hazards Modeling(“Extended” Weibull analysis) Now, what would the optimal policy be if we have the benefit of extra data - namely, condition data?
VA+OA+Other monitored data Event information CMMS Work orders CBM data Inspection data Best Decision Event data Decision Model A Watchdog Agent Statisical models (EXAKT), Expert Systems, trained neural nets, Case Based Reasoning …
Data missing in this region More data investigations
B C A D Oil change interval Oil changes Fe ppm Working age
Missing oil change events Missing ‘OC’ events?
Strange History? Strange history
No events to support this jump in values Investigating the strangeness
The Definition of Failure A major challenge in CBM optimization Initially a failure was declared when wear metals were high. This was like forcing the model to “chase its tail”. Needed a physical definition of failure based on the observable condition of the wheel motor at overhaul. Based on the new definition (gear damage), the number of histories ending in failure doubled. Model “fit” improved dramatically.
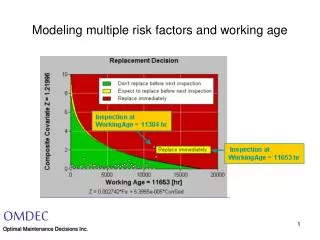
Failed at WorkingAge = 11660 hr Inspection at WorkingAge = 11384 hr Inspection at WorkingAge = 11653 hr Had we replaced at 11384 hr…or 11653 hr…!!!!
CR = 3 25% $1M CR = 5 44% $1.7M CR = 6 50% $2M Profitability Impact of Optimized CBM
Model B Model A Model A Model A The onion skins of CBM CBM (least intrusive) $ CBM phys. inspection PF $ . . . CBM overhaul PF $ . . . FF $
Truck Engine layers of discovery • Copper appearing in oil analysis • Checked filter – copper particles found • Drained engine oil – copper particles found on drain plugs • Removed the engine sump and discovered that the main oil pump drive gear-retaining bolt had come loose. • Failure mode: excessive wear on brass bushings due to improperly torqued retaining bolt Reference:Derek Wilcock, Sishen Iron Ore Mine, "Engine Failure Results in Proactive Solutions". Practicing Oil Analysis Magazine. September 2005
Cepstrum 4 highest peaks 1x sidebands Demodulation Normalization • Screening Matrix • Columns: • 10 preselected orders • 2 highest non-synch peaks in hi and lo ranges • Noise floor • Rows: • from previous inspection • Deviation from Av + 1 Possible Bearing defects Signal processing Fault diagnosis Diagnostic templates For a major comp. group Pass or fail each diagnosis Decision making Relative severity Machine (several test points) Vibration spectral data Component Specific Diagnostic Matrices (CSDM) Unique component specific frequencies Adjacent components Differences from previous inspection. Deviations from Av + 1
Component specific diagnostic matrix and diagnostic templates Close-coupled (no brgs in pump) 4 brg RAD TAN 4 brg overhung rotor RAD TAN vertical
Spectrum 3.61 7.22 1x 1x 1x 1x 0 1 2 3 4 5 6 7 8 9 10 2x 2x Peaks in the spectrum with 1x spacings Cepstrum Peaks in the spectrum with 3.61x spacings
Harmonic energy related to inner race defect softer impact Repetitive change in impact forces causing amplitude modulation appearing as sidebands Inner race defect travels in and out of the load zone harder impact
Expert rule using 1x vibrations • Consider (for simplicity only the 1x vibration levels of) the vertical motor and centrifugal pump (with coupling), • Excessive (7-10 Vdb over baseline) 1x vibrations. • Could mean motor imbalance, pump imbalance, angular misalignment, foundation horizontal flexibility, a radial or thrust bearing clearance problem, or motor cooling fan blade damage. Which? • Axial and radial data at both locations angular misalignment?. • Radial is higher than axial motor imbalance or pump imbalance? • Axial motion is characteristic (due to rocking) of unbalance in a vertical pump. Which component is unbalanced? • In a vertical pump one direction, the direction of external structural support, is always stiffer than the other directions. The radial axis in this case is the direction of structural flexibility. • Low 1x levels at the pump in the tangential direction because tangential axis is the direction of high structural stiffness and therefore the tangential component of the vibration due to motor imbalance does not transmit to the pump.
Hybrid decision agent EXAKT RULE Optimal decision