Download
1 / 1
10 likes | 112 Views
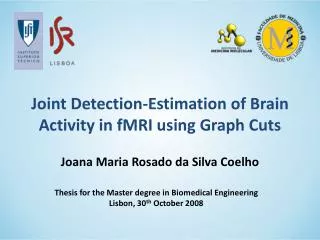
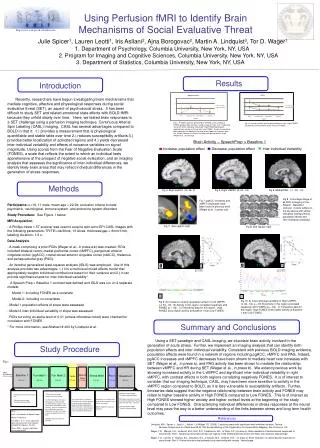
Investigating brain mechanisms during social evaluative threat using Continuous Arterial Spin Labeling (CASL) imaging, identifying areas reflecting stress responses linked with Fear of Negative Evaluation Scale (FONES).

E N D
http://www.scan.psych.columbia.edu Julie Spicer1, Lauren Leotti1, Iris Asllani2, Ajna Borogovac2, Martin A. Lindquist3, Tor D. Wager1 1. Department of Psychology, Columbia University, New York, NY, USA 2. Program for Imaging and Cognitive Sciences, Columbia University, New York, NY, USA 3. Department of Statistics, Columbia University, New York, NY, USA Results Introduction Recently, researchers have begun investigating brain mechanisms that mediate cognitive, affective and physiological responses during social evaluative threat (SET), an aspect of psychosocial stress. It has been difficult to study SET and related emotional state effects with BOLD fMRI because they unfold slowly over time. Here, we tested brain responses to a SET challenge using a perfusion imaging technique, Continuous Arterial Spin Labeling (CASL) imaging. CASL has several advantages compared to BOLD in that it: 1.) provides a measurement that is physiological quantifiable and stable table over time 2.) reduces susceptibility artifacts 3.) provides better localization of activated regions and 4.) yields decreased inter-individual variability and effects of nuisance variables on signal magnitude. Using scores from the Fear of Negative Evaluation Scale (FONES), a scale that reflects the extent to which an individual feels apprehensive at the prospect of negative social evaluation, and an imaging analysis that assesses the significance of inter-individual differences, we identify likely brain areas that may reflect individual differences in the generation of stress responses. Fig 2. A median split was performed on FONES scores yielding 2 FONES groups, High and Low. Using a scale of 1 to 4, with 1 indicating “not at all” and 4 indicating “extremely,” High FONES participants reported more anxiety at Arrival than Low FONES. Anxiety increased for both groups by Pre-Speech-Prep and fell by Departure. Previous work has shown increases in anxiety and heart rate during Speech-Prep (Wager et al., in press a;b) Fig 3. Levels of salivary cortisol decreased over time. High FONES showed consistently higher levels than Low FONES. Brain Activity – SpeechPrep > Baseline 1 Using Perfusion fMRI to Identify Brain Mechanisms of Social Evaluative Threat Increase, population effect Decrease, population effect Inter-individual Variability Methods Fig 4. Right pgACC (12, 46, 4) Fig 5. Right vMPFC (8, 42, -12) Fig 6. Medial PAG (-1, -30, -14) Fig 8: A montage image of all ROIs emerging in the Speech - Baseline 1 contrast. (Colors adhere to the key above with yellow indicating overlap among population effects and inter-individual variability). Fig 7: pgACC increases and vMPFC decreases have been found in previous work (Wager et al., in press a;b) • Participants: n=18, 11 male; mean age = 22.94; exclusion criteria include: psychiatric, neurological, immune system, and endocrine system disorders • Study Procedure: See Figure 1 below. • MRI Acquisition • A Phillips Intera 1.5T scanner was used to acquire spin-echo EPI CASL images with the following parameters: TR/TE/=4s/36ms, 13 slices, thickness/gap = 8mm/1mm, labeling duration= 1.8 s. • Data Analysis • - A mask comprising a priori ROIs (Wager et al., in press a;b) was created. ROIs included bilateral ventro-medial prefrontal cortex (vMPFC), perigenual anterior cingulate cortex (pgACC), rostral dorsal anterior cingulate cortex (rdACC), thalamus, and periaqueductal gray (PAG). • An iterative generalized least-squares analysis (IGLS) was employed. Use of this analysis provides two advantages: 1.) it is a multi-level mixed effects model that appropriately weights individual contributions based on their variance and 2.) it can provide significance tests for inter-individual variability* • A Speech-Prep > Baseline 1 contrast was defined and IGLS was run on 2 separate models: • Model 1: including FONES as a covariate • Model 2: including no covariates • Model 1 population effects of slope were assessed • Model 2 inter-individual variability in slope was assessed • ROIs surviving an alpha-level of 0.01 (unless otherwise noted) were checked for correlation with FONES • * For more information, see Abstract # 460 by Lindquist et al. Fig 7. See caption right Fig 8. See caption right A B A B High FONES Low FONES High FONES Low FONES Baseline 1 Fun Math 1 Fun Math 2 Antic Speech Stress Math Recov Baseline 2 Baseline 1 Fun Math 1 Fun Math 2 Antic Speech Stress Math Recov Baseline 2 C C Fig 10. A) Inter-individual variability in Right vMPFC (4, 36, -16), p <.05. B) Activity in this region correlated negatively with FONES (p < .03). C) Timeseries data for this region: High FONES show higher activity at Baseline 1 than Low FONES. Fig 9. A) Increase in activity (population effect) in Left vMPFC (-4, 54, -16). B) Activity in this region correlated negatively with FONES (p < .02). C) Timeseries data for this region: High FONES show higher activity at Baseline 1 than Low FONES. Summary and Conclusions Using a SET paradigm and CASL imaging, we elucidate brain activity involved in the generation of acute stress. Further, we implement an imaging analysis that can identify both population effects and inter-individual variability. Consistent with previous BOLD imaging evidence, population effects were found in a network of regions including pgACC, vMPFC and PAG. Indeed, pgACC increases and vMPFC decreases have been shown to mediate heart rate increases with SET (Wager et al., in press a), and PAG activity has been shown to mediate the relationship between vMPFC and HR during SET (Wager et al., in press b). We extend previous work by showing increased activity in the L vMPFC and significant inter-individual variability in right vMPFC, with contrast effects in both regions correlating negatively FONES. It is of interest to consider that our imaging technique, CASL, may have been more sensitive to activity in the vMPFC region compared to BOLD, as it is less vulnerable to susceptibility artifacts. Further, timeseries data suggest that the negative relationship between brain activity and FONES may relate to higher baseline activity in High FONES compared to Low FONES. This is of interest as High FONES showed higher anxiety and higher cortisol levels at the beginning of the study compared to Low FONES. Characterizing individual differences in stress responses at the neural level may pave the way to a better understanding of the links between stress and long term health outcomes. Study Procedure Fig 1. CASL SCANNING Baseline 1 Speech Prep Fun Math 1 Fun Math 2 Stress Math Recov Antic Baseline 2 5.3 min 5.3 min 5.3 min 2.7 min 2.4 min 5.3 min 2.7 min 5.3 min *Salivary cortisol sample * Anxiety Subjective Rating Participants leave the scanning room and complete the STAI and a post-scan interview. (20 min) *Salivary cortisol sample *Anxiety Subjective Rating *Salivary cortisol sample *Anxiety Subjective Rating The SET challenge is introduced. Participants are told that they will be preparing a speech to be delivered to two professors after scanning. They are introduced to two confederates, posing as professors, through a pre-made video that appeared to be a live feed. THREAT subjective ratings are collected. Participant arrival and consent (20 min) *Salivary cortisol sample *Anxiety Subjective Rating Participants are told that they were randomly selected not to deliver the speech. RELIEF subjective ratings are collected. The speech topic is presented. Participants are asked to prepare a speech on the qualities that make them good candidates for their dream jobs. Information on the dream job was gleaned from a pre-scan battery of questions. KEY: Antic = Anticipation of Speech Topic Recov = Recovery Fun Math 1 & 2 = serial subtraction tasks introduced as “brain teasers” provided to help pass the time Stress Math = a serial subtraction task as part of SET References Lindquist, M.A., Spicer, J., Leotti, L., Asllani, I.,& Wager, T.D. (2009). Localizing areas with significant inter-individual variation: Testing Variance Components in a Multi-level GLM. 15th Annual Meeting of the Organization for Human Brain Mapping. San Francisco, CA. Wager, T.D., Waugh, C.E., Lindquist, M.A., Noll, D.C., Fredrickson, B.L., & Taylor S.F. (in press a). Brain mediators of cardiovascular responses to social threat, Part I: Reciprocal dorsal and ventral sub-regions of the medial prefrontal cortex and heart-rate reactivity. NeuroImage. Wager, T.D., van Ast, V., Hughes, B.L., Davidson, M.L., Lindquist, M.A., Ochsner, K.N. . (in press b). Brain mediators of cardiovascular responses to social threat, Part II: Prefrontal-subcortical pathways and relationship with anxiety. NeuroImage.