Download

1 / 9
270 likes | 978 Views
Chapter 2 The tools of economic analysis. David Begg, Stanley Fischer and Rudiger Dornbusch, Economics , 8th Edition, McGraw-Hill, 2005 PowerPoint presentation by Alex Tackie and Damian Ward. Models and data. Model a framework based on simplifying assumptions

E N D
Chapter 2The tools of economic analysis David Begg, Stanley Fischer and Rudiger Dornbusch, Economics, 8th Edition, McGraw-Hill, 2005 PowerPoint presentation by Alex Tackie and Damian Ward
Models and data • Model • a framework based on simplifying assumptions • helps to organise our economic thinking • Data • the economist’s link with the real world • time series • cross section
Real and nominal • Many economic variables are measured in money terms • Nominal values • measured in current prices • Real values • adjusted for price changes compared with a base year • measured in constant prices
Diagrams … help to analyse patterns and trends in data
Diagrams (2) … help to analyse patterns and trends in data
Diagrams (3) … help to analyse patterns and trends in data
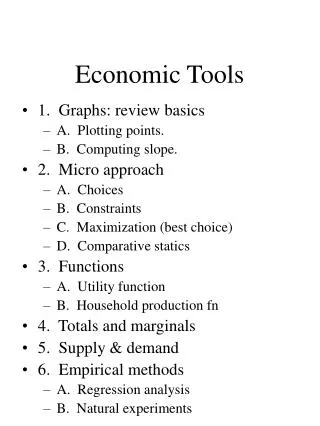
Economic models:an example • To organise our thinking we need a simplified picture of reality • focusing on key elements • Quantity of tube journeys demanded = f(Prices, income, preferences)
Relationships Diagrams help economists to explore relationships between economic variables
Evidence in economics • Scatter diagrams help us to confront economic theory with empirical reality • Econometrics takes this further using statistical techniques • Evidence may allow us to reject a theory • or accumulate support for it