Download
1 / 27
270 likes | 445 Views
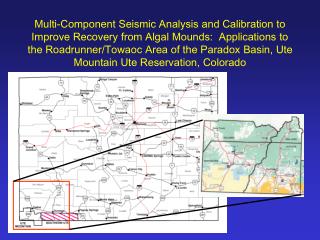
Multi-Component Seismic Analysis and Calibration to Improve Recovery from Algal Mounds: Applications to the Roadrunner/Towaoc Area of the Paradox Basin, Ute Mountain Ute Reservation, Colorado. Goals:

E N D
Multi-Component Seismic Analysis and Calibration to Improve Recovery from Algal Mounds: Applications to the Roadrunner/Towaoc Area of the Paradox Basin, Ute Mountain Ute Reservation, Colorado
Goals: • Develop an approach to identify algal mounds and their productive characteristics with greater accuracy • Benefits: • More cost effective production from existing algal mound fields • Better success for discovering new algal mound fields
PARADOX BASIN UPPER ISMAY ALGAL MOUND PLAY The Paradox Basin extends from Utah into Colorado. One exploration target with significant discoveries still possible is the Ismay Algal Mound Play. The potential exists because these mounds may have little structural expression, and complex reservoir heterogeneity making accurate siting of wells critical to success.
Algal Mounds Algal Mound (Salar d’Uyuni, Bolivia) Muleshoe bioherm, a 60 m high reef mound of Late Mississippian age exposed along the western escarpment of the Scaremento Mountains, New Mexico.
Algal Mounds can have a substantial amount of internal reservoir heterogeneity
Game Sixteen: December 23 – Pittsburgh at Tampa Bay. “After analysis on Warren Sapp playing offense for the Buccs, I liken it to a 3-D seismic data with several types of seismic attributes revealing geologic factors that control the location of productive algal mound reservoirs in the Paradox Basin.” (anonymous posting on sports website http://www.baseballology.com/warrzone/article.php3?ArticleID=788)
PROJECT TEAM MEMBERS • Ute Mountain Ute Tribe • Red Willow Production Company • Legacy Energy • Colorado School of Mines • WesternGeco • Axis Geophysical • Eby Petrographic Services • Schlumberger Oilfield Services • Golder Associates • U. S. Dept. of Energy
Technical Oversight & Planning Legacy Energy (Claudia Rebne) Technical Manager - Seismic Red Willow (Steve Dobbs) Technical Manager - Geology Colorado School of Mines (Tom Davis) – Seismic Acquisition & Interpretation Review Solid State – (Trent Middleton) 3D Seismic Acquisition Schlumberger (Richard Pearcy ) – 3C VSP Acquisition Technical Contractors WesternGeco (Rich Van Doak) – “Conventional” 3D Seismic Processing Axis Geophysics (Bob Parney) – AVO 3D Seismic Processing Eby Petrograhpic (Dave Eby) – Core Studies PROJECT MANAGEMENT ORGANIZATION & RESPONSIBILITIES U. S. Dept. of Energy (Virginia Weyland) Contract Manager Golder Associates Inc. (Paul La Pointe) Project Management Ute Mountain Ute Tribe - Resource and Land Owners
ALGAL MOUND EXPLORATION & RESERVOIR DEVELOPMENT CHALLENGES Upper and Lower Ismay carbonates produce oil and gas from porous algal mounds at drill depths of about 6000’. Anhydrites provide a top and lateral seal. The mounds generally trend northwest to southeast and are typically 1 to 2 miles long and ¼ to ½ mile wide. Typical field sizes are 1 to 5 MMBOE with average per well reserves of about 300,000 BOE. Some wells have produced over 1 million BOE. Upper Ismay carbonate mounds are generally 50 to 100’ thick, while Lower Ismay mounds are 40-70’ thick. Mounds are surrounded and overlain by Upper Ismay massive anhydrite that thins abruptly over the tops of the mounds. Lateral stratigraphic changes from porous algal mound facies to off-mound anhydrite facies are abrupt. The key factor associated with the exploration of Ismay algal mounds is predicting these stratigraphic changes. Secondary exploration risk factors include predicting porosity, permeability and fluid content of mounds. Development of a detailed lithologic model over a known reservoir is a critical technical issue in calibrating the seismic data for reservoir development and future exploration. A detail core study of the Road Runner and Towaoc fields is included in the proposed work to resolve this issue.
Conventional 3D Seismic was first used in the mid-1990’s. This improved drilling success (~50% success) as it did a much better job in delineating lateral stratigraphic changes from off-mound anhydrite to porous carbonate mound. OVERVIEW OF PREVIOUS USE OF SEISMIC IN ALGAL MOUND EXPLORATION IN THE PARADOX BASIN Conventional 2D Seismic was used in Early 1980’s for Exploration. This improved drilling success, but many dry holes were still drilled because of Fresnel zone and out-of-plane migration problems
AN EXAMPLE: THE KIVA FIELD The 1984 discovery of Kiva field was the result of a geologic model that was confirmed by conventional 2D seismic data. The seismic data was carefully processed and took into consideration the cyclic nature of the geology in the Paradox Formation. After the confirmation well flowed 1,050 BOPD + 750 Mcfgpd from the Upper Ismay, Meridian Oil and BWAB proceeded in January 1985 to acquire a 3D seismic survey over the possible extent of the new field. The results of that survey show that the 3D images the porous part of the algal mound and demonstrates mound morphology. The survey also demonstrates that the conventional 2D strike line images the crest of the mound from out of the plane of the section (sideswipe), and the 3D migration of the data volume is able to place the image of the mound into its proper position.
ANOTHER EXAMPLE: THE BLANDING PROSPECT AREA The porous mounds are encased in thick massive anhydrite which thins or disappears over the tops of the mounds. This lithology change produces seismic amplitude dims and isochron thicks. The 2D seismic data from the 1980s are used to identify prospects, and new 3D seismic surveys provide for accurate imaging of the thickest and most prolific parts of the algal mounds. The Horse Canyon Federal # I - I 0 well was drilled just south of the Blanding Prospect Area by Miller Energy in 1998. This well location was based on 3D seismic data, and is only 700 feet away from a dry hole drilled in the 1980s based on 2D seismic data. The well IP'd for 960 BOPD and 3 MMCFGPD. This is a good case history illustrating that the older 2D seismic data did reliably detect a mound, but the 3D seismic data was required to image the productive portion of the mound and resulted in a prolific new discovery.
SUMMARY 2D Seismic good for finding mound complexes, but bad for describing geometry of mound and lateral facies variations Conventional 3D good for describing external mound geometry, and better at describing facies variations and reservoir quality, but still imperfect for reservoir properties and internal geometry
WHY 3D MULTI-COMPONENT SEISMIC? The key to developing a better image of the reservoir’s internal geometry and flow properties is to utilize fluid saturations and azimuthal processing that can directly respond to oriented heterogeneities and changes in fluid saturations. Thus, acquisition of shear-wave data and advanced azimuthal processing or both shear- and compressional-wave data will potentially provide a much higher resolution of internal mound geometry and, from a reservoir engineering standpoint, a better model of the distribution of reservoir porosity and permeability.
STRATEGY • Acquire 3D Multi-Component data over existing algal mound production as well as off-mound area (Towaoc & Roadrunner Fields) • Acquire a Multi-Component VSP (vertical seismic profile) in a well to help calibrate 3D processing and acquisition • Process 3D data for P-wave, S-wave, AVO and anisotropic velocity attributes • Calibrate processed seismic data against core a facies interpretations • Calibrate processed seismic data against reservoir engineering data
Data Core and Well Data 10 cores in either the Upper or Lower Ismay in the immediate area. Including relevant core from the surrounding area a total of 500 feet of core. 34 wells: 3wells with well histories and conventional logs. 19 of the 34 wells are producing wells and have production data Detailed tops database and subsurface mapping (Red Willow) Existing Seismic Data 600 miles of conventional 2-D data already acquired. 100 miles of which are currently being reprocessed by Red Willow. Seismic data to be acquired during study 6 square miles of three-dimensional, three-component data. 1 full waveform VSP to calibrate to the S-wave seismic data.
Phase 1: Data gathering and acquisition Task Description Result Task 1.1: Core and log data gathering Assemble data base, gather electronic and paper well data, schedule access to cores Task 1.2: Seismic Acquisition Acquire three dimensional three-component seismic data 3D3C seismic data field tapes. Task 1.3: VSP Acquisition Acquire three component Vertical Seismic Profile Three component VSP. Task 1.4: Seismic Processing Process all seismic data including conventional P-wave, anisotropic P-wave, azimuthal AVO, and S-wave processing (1)Conventional P-wave data volume. (2)Anisotropic velocity P-wave data volume. (3)Azimuthal AVO data volume (4)S-wave volume
Phase 2: Data analysis Task Description Result Task 2.1: Core study Map on and off reservoir lithology by using cores, thin sections and conventional logs. Lithologic model and map. Task 2.2: Conventional Seismic interpretation Interpret the conventional (Three dimensional P-wave) data volume in order to calibrate seismic data to lithology. P-wave time thickness and attribute mapping. Task 2.3: S-wave and attribute seismic interpretation Interpret the 3 seismic data volumes in order to calibrate seismic data to lithology. (1) S-wave time thickness and attribute mapping. (2)Anisotropic velocity map. (3)Azimuthal AVO mapping. Task 2.4: Engineering data interpretation Examine production data and well tests to correlate reservoir performance to lithology. Production index (PI) map of reservoir and inferred permeability.
Phase 3: Modeling Task Description Result Task 3.1: Lithologic/geologic structure modeling Build model for seismic modeling based on core study (Task 2.1) 3-D computer model of lithology based on core analysis. Task 3.2: Stress field model Develop map of 3-D stress field based on velocity anisotropy (Task 2.3) 3-D computer model of stress based on anisotropic velocity analysis. Task 3.3: Seismic simulation Determine link between seismic response and both lithology and stress by modeling the seismic response interpreted in Tasks 2.2 and 2.3 and determine if there is a link between the seismic data and the lithology and stress (Tasks 3.1 and 3.2) 3-D computer model of seismic response based on lithology, conventional seismic interpretation, attribute mapping and results of stress field mapping. Task 3.4: Flow simulation Demonstrate link between seismic response and reservoir response (i.e. permeability, porosity etc.) by simulating flow through geologic model developed in tasks 3.1, 3.2, and 3.3 and the engineering data interpreted in task 2.3 3-D reservoir simulation incorporating all previous mapping and modeling tasks to show extent to which seismic data can predict internal mound architecture.
Phase 4: Reporting Task Description Result Task 4.1 Workshops for tribes Workshops for tribes and all relevant parties (1)Initialization workshop (2)Mid-project progress workshop (3)Project wrap up workshop Task 4.2 Website Website containing project info, technical transfer of findings, status reports and project learnings Website Task 4.3 Reporting Progress and final reports for the DOE and tribes (1)Three bi-annual reports (2)One final report Task 4.4 Briefing for Core Presentation of status and results for DOE in Tulsa Presentation for Core as required by solicitation Task 4.5 Journal articles and public presentations Publication of one paper in a peer-reviewed journal, and presentation of results and a technical conference (1)Published technical paper (2)Conference presentation
Project Status • WesternGeco’s decision to leave the seismic acquisition business in North America required finding a new contractor. SolidState will be doing acquisition, but this phase of the project has been delayed about 5 months as a result • Permitting in progress for acquisition • Seismic processing and acquisition teams are interacting to optimize survey and processing results • VSP planning underway
Near-Term Activities • SPRING 2003 • Permitting of 3D acquisition • Acquisition of 3D multicomponent data • VSP acquisition • SUMMER 2003 • Processing • Preliminary Interpretations • Core Study
Contacts for Key Personnel AXIS Geophysics Bob Parney (303) 831-0544 (303) 318-7798 (fax) Bob.Parney@axisgeo.com Legacy Energy Claudia Rebne (970) 325-0038 (303) 475-5292 cell (801) 457-7765 (fax) claudiar@rmi.net WesternGeco Rich Van Dok (303) 629-9250 rvandok@westerngeco.com CSM Reservoir Characterization Group Tom Davis (303) 273-3938 tdavis@mines.edu Red Willow Production Company Steve Dobbs (970) 563-0140 or (970) 563-0145 (970) 563-3681 (fax) (970) 759-1340 (cell) swdobbs@southern-ute.nsn.us Eby Petrographic Dave Eby (303) 738-9697 or 778-7173 (303) 730-3698 (fax) epceby@aol.com Schlumberger Richard Pearcy (972) 789-7736 pearcyr1@dallas.wireline.slb.com Golder Associates Inc. Paul La Pointe (425) 883-0777 (425) 882-5498 (fax) plapointe@golder.com Solid State Trent Middleton (403) 255-9388 (403) 255-4697 (fax) trent.middleton@sstate.com