User Interface Design Principles
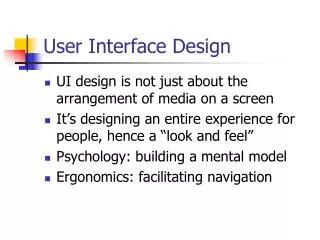
User Interface Design Principles. User Interface Design. We’ll focus on website design, but the same concepts apply to standalone applications too What makes a good web site? Similar to, but differences from printed medium Hyperlinks! Attempt to make web page “Free Standing”

User Interface Design Principles
E N D
Presentation Transcript
User Interface Design • We’ll focus on website design, but the same concepts apply to standalone applications too • What makes a good web site? • Similar to, but differences from printed medium • Hyperlinks! • Attempt to make web page “Free Standing” • Someone may link to it, or print it
Same Questions as Print • Who is talking? Is it an individual or an institution? • What is the content about? • Titles, Headers • Consider bookmarks • When? • Old CS Page (ulp) • Where on your site are you currently located? • Navigational aids or pointers to the main page may be appropriate. • Button Bars
Every page should have • Informative title • Creator’s identity • Creation or revision date • At least one link back to home • These basic elements will get you 90% of the way to an understandable interface
Interface Design Tips • Build Navigational aids. • Navigation bars, frames • Critical for giving user a sense of where they are • Must provide context, e.g. bar with page headers • User shouldn’t have to go “back” to figure this out • Avoid dead-end pages • Keep download time short • Frustration after 10 seconds • Reduce clicking • Users prefer menus with at least 5-7 links • Prefer dense screen with many choices over deep path with few choices
Clicks per User • Study by Huberman, et. al 1998 • Users clicking on a given number of links within a site • Most click once! • Average is three clicks • Huberman compares to brownian motion, “laws of the web”
Interface Design Tips • Consistency! • E.g., keep “home” button in the same place • Simplicity often appreciated • Offer feedback • Design for the disabled • ALT tags • E.g., modem user might disable graphics • Use elements as designed • E.g. don’t use blank GIF as a spacer
Organizing Information • Divide your content into logical units • Establish a hierarchy of importance among the units • Use the hierarchy to structure relations among units • Build a site that closely follows your information structure • Analyze the functional and aesthetic success of your system
Chunk your Info • Chunking • Short chunks of information that fit on a screen • Few users read long passages of text on screen • Discrete chunks lend themselves to a link • Supports a uniform format
Site Design • “Chunk” your information
Case Study • Time is Money -- redesign at Sun • Average employee views 12 intranet pages per day • Could save 5 minutes per week per employee by redesigning the site • $10 million/year in “lost” time
Design Considerations • Graphics vs. Text menus, or both • Animations (e.g. shockwave), older browsers, web TV won't view them • "Whats New" feature - must be maintained, can help repeat visitors • FAQ page • Site Cover - splashy graphics or animation to draw users in. For others, an annoying click that needs to be bypassed.
User Centered Design • Build from your users and work your way up! • Ethnographic studies • User interviews • Beta test studies • Focus groups • Readjustment to meet user needs
Page Design • Don’t dumb-down the readers -- just design to their needs • short, fast, easy access • Guide the user • Left to right, top to bottom • design appropriately to guide user to the next element • Headlines at the top • Don’t forget whitespace
Page Design • Avoid too-fancy graphics (unless experienced) • Label icons • Combine navigation bar with logo/graphics, use consistently! • Remember that the screen is small • Graphics or Forms too large: Layout more than 600 pixels wide may not properly render on a single page.
Page Design Guidelines Grid Layout
Page Guidelines • Consider tables without borders to control text layout • Caution with frames!
Graphics • If high bandwidth available, use it! • Guidelines • 28.8kbps modem sends about 3.5Kb/second • 35Kb graphic could take 10 seconds alone • Formats • GIF • Consider interlaced to show progress • Caution on animated GIF’s • JPEG • Generally better for photography • Designer can choose quantization and hence image size/quality
Interlaced GIF Progressive Display; Takes same amount of time to show
Optimizing Graphics • Consider a custom palette. You can have a finer palette of colors at your disposal than the general palette. • To reduce the size of your graphics, consider reducing the number of colors. You can experiment with smaller color palettes and see the results.
Image Maps Use Client-Side Image maps over Server-side maps
Digital Audio and Video • Use at your best discretion!
Color • Technical characteristics of color • Hue : Frequency / Wavelength • Value : Intensity of the hue • Saturation : Purity of the color from gray/vivid • Use the color wheel Choose: Opposite, nearly opposite Varying degree of value for hue Equidistant hues
Uses of Color • Call attention to specific data or information • Identify elements of structure and processes • Portray natural objects realistically • Depict the logical structure of ideas and processes • Portray time and progress • Increase appeal, memorability, and comprehensibility • Reduce errors of legibility or interpretation • Increase the number of dimensions for coding data
Pitfalls of Color • May cause problems for color deficient vision (8% of Caucasian males) • May cause visual fatigue with strong colors • May contribute to visual confusion if too complex • May have negative cultural or historical associations • E.g., using black in master/slave controller diagram • May exhibit confusing cross-disciplinary or cultural connotations • E.g., Red in Chinese = Warm/Happy, America = Hot/Flashy
The 10 Commandments of Color • Use five +/- two colors • Use foveal and peripheral colors appropriately • Blue for background, not for center • Black, white, yellow for periphery, no red or green • No blue for text or diagrams
The 10 Commandments of Color • Minimum shift in color/size • Light text on dark background for dark environment • Dark text on light background for light environment • High-chroma, spectrally extreme colors may create illusions of shadows/after-images • Bright blue/green • Use familiar, consistent color coding • Red – stop, danger, hot, fire. Yellow – Caution, slow • Green – go, okay, safe. Blue – Cold, water, death • Warm colors – Action, response • Cool colors – stats, background, distance • Gray, white – neutral • Context-dependent
The 10 Commandments of Color • Use the same color for grouping related elements. • Color to your audience • Men prefer blue to red, women red to blue • Men prefer orange to yellow, women yellow to orange • Young prefer bright, old prefer sober/restrained colors • Use high-value, high-chroma colors to attract attention. • Bright red better / faster than yellow, orange • Older viewers have easier time with bright
The 10 Commandments of Color • Use redundant coding of shape, as well as color, if possible. The more cues to remember an object, the better. • Use color to enhance black-and-white information. • People remember better with color • Different emotional reaction • People do not learn any better or faster with color
Evaluating Your UI • User Testing • Focus Group • Ask users to perform a task, watch sequence of steps taken • Time users on specific tasks • E.g., shopping for a specific item