Download
1 / 26
260 likes | 287 Views
Learn about different costs in business operations, understand cost centers, full costing, absorption costing, and more to enhance budgeting expertise for improved financial management. Explore break-even analysis, total revenue strategies, and budgeting techniques.

E N D
Costs • Anything incurred during the production of the good or service to get the output into the hands of the customer • The customer could be the public (the final consumer) or another business • Controlling costs is essential to business success • Not always easy to pin down where costs are arising!
Cost Centres • Parts of the business to which particular costs can be attributed • In large businesses this can be a particular location, section of the business, capital asset or human resource/s • Enable a business to identify where costs are arising and to manage those costs more effectively
Full Costing • A method of allocating indirect costs to a range of products produced by the firm. • e.g. if a firm produces three products - a, b, and c - and has indirect costs of £1 million, assume proportion of direct costs of 20% for a, 55% for b and 25% for c • Indirect costs allocated as 20% of 1 million to a, 55% of £1 million to b and 25% of £1 million to c
Absorption Costing • All costs incurred are allocated to particular cost centres – direct costs, indirect costs, semi variable costs and selling costs • Allocates indirect costs more accurately to the point where the cost occurred
Marginal Costing • The cost of producing one extra unit of output (the variable costs) • Selling price – MC = Contribution • Contribution is the amount which can contribute to the overheads (fixed costs)
Standard Costing • The expected level of costs associated with the production of a good/service • Actual costs – Standard costs = Variance • Monitoring variances can help the business to identify where inefficiencies or efficiencies might lie
Total Revenue • Total Revenue = Price x Quantity Sold • Price can be raised or lowered to change revenue – price elasticity of demand important here • Different pricing strategies can be used – penetration, psychological, etc. • Quantity Sold can be influenced by amending the elements of the marketing mix – 7 Ps
Break Even Analysis Costs/Revenue TR Total revenue is determined by the price charged and the quantity sold – again this will be determined by expected forecast sales initially. The break even point occurs where total revenue equals total costs – the firm, in this example, would have to sell Q1 to generate sufficient revenue to cover its costs. Initially a firm will incur fixed costs, these do not depend on output or sales. TR TC The lower the price, the less steep the total revenue curve. As output is generated, the firm will incur variable costs – these vary directly with the amount produced. VC The total costs therefore (assuming accurate forecasts!) is the sum of FC+VC FC Q1 Output/Sales
Break Even Analysis Costs/Revenue If the firm chose to set price higher than £2 (say £3) the TR curve would be steeper – they would not have to sell as many units to break even TC TR (p = £2) TR (p = £3) VC FC Q2 Q1 Output/Sales
Break Even Analysis TR (p = £1) Costs/Revenue If the firm chose to set prices lower (say £1) it would need to sell more units before covering its costs. TR (p = £2) TC VC FC Q3 Q1 Output/Sales
Break Even Analysis TR (p = £2) TC Costs/Revenue VC Profit Loss FC Q1 Output/Sales
Break Even Analysis TR (p = £2) TR (p = £3) TC Margin of safety shows how far sales can fall before losses made. If Q1 = 1000 and Q2 = 1800, sales could fall by 800 units before a loss would be made. Costs/Revenue A higher price would lower the break even point and the margin of safety would widen. VC Assume current sales at Q2. Margin of Safety FC Q1 Q3 Q2 Output/Sales
Costs/Revenue Eurotunnel’s problem High initial FC. Interest on debt rises each year – FC rise therefore. FC 1 FC Losses get bigger! TR VC Output/Sales
Break Even Analysis • Remember: • A higher price or lower price does not mean that break even will never be reached! • The break even point depends on the number of sales needed to generate revenue to cover costs – the break even chart is NOT time related!
Break Even Analysis • Importance of Price Elasticity of Demand: • Higher prices might mean fewer sales to break even but those sales may take a longer time to achieve • Lower prices might encourage more customers but higher volume needed before sufficient revenue generated to break even
Break Even Analysis • Links of break even to pricing strategies and elasticity • Penetration pricing – ‘high’ volume, ‘low’ price – more sales to break even • Market Skimming – ‘high’ price ‘low’ volumes – fewer sales to break even • Elasticity – what is likely to happen to sales when prices are increased or decreased?
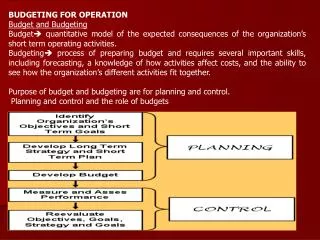
Budgets • Estimates of the income and expenditure of a business or a part of a business over a time period • Used extensively in planning • Helps establish efficient use of resources • Help monitor cash flow and identify departures from plans • Maintains a focus and discipline for those involved
Budgets • Flexible Budgets – budgets that take account of changing business conditions • Operating Budgets – based on the daily operations of a business • Objectives Based Budgets - Budgets driven by objectives set by the firm • Capital Budgets – Plans of the relationship between capital spending and liquidity (cash) in the business
Budgets • Variance – the difference between planned values and actual values • Positive variance – actual figures less than planned • Negative variance – actual figures above planned