Download
1 / 7
70 likes | 142 Views
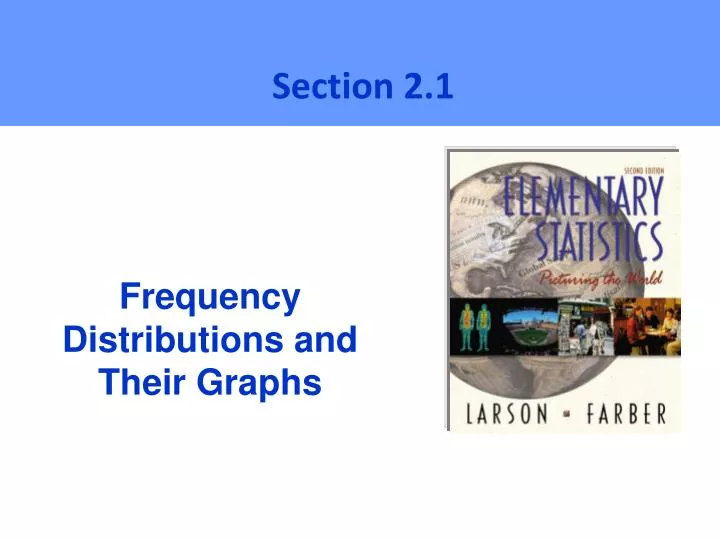
Section 2.1. Frequency Distributions and Their Graphs. Frequency Distributions. Minutes Spent on the Phone. 102 124 108 86 103 82 71 104 112 118 87 95 103 116 85 122 87 100 105 97 107 67 78 125 109 99 105 99 101 92.

E N D
Section 2.1 Frequency Distributions and Their Graphs
Frequency Distributions Minutes Spent on the Phone 102 124 108 86 103 82 71 104 112 118 87 95 103 116 85 122 87 100 105 97 107 67 78 125 109 99 105 99 101 92 Make a frequency distribution table with five classes. Minimum value = Maximum value = 67 Key values: 125
Steps to Construct aFrequency Distribution 1. Choose the number of classes Should be between 5 and 15.(For this problem use 5) 2. Calculate the Class Width Find the range = maximum value – minimum. Then divide this by the number of classes. Finally, round up to a convenient number. (125 - 67) / 5 = 11.6 Round up to 12. 3. Determine Class Limits The lower class limit is the lowest data value that belongs in a class and the upper class limit is the highest. Use the minimum value as the lower class limit in the first class. (67) 4. Mark a tally | in appropriate class for each data value. After all data values are tallied, count the tallies in each class for the class frequencies.
Construct a Frequency Distribution Minimum = 67, Maximum = 125 Number of classes = 5 Class width = 12 3 5 8 9 5 Class Limits Tally 78 90 102 114 126 67 79 91 103 115 Do all lower class limits first.
Frequency Histogram 3 5 8 9 5 Class 67 - 78 79 - 90 91 - 102 103 -114 115 -126 Time on Phone 9 9 8 8 7 6 5 5 5 4 3 3 2 1 0 7 8 . 5 9 0 . 5 1 0 2 . 5 1 1 4 . 5 1 2 6 . 5 6 6 . 5 minutes
Other Information Midpoint:(lower limit + upper limit) / 2 Relative frequency:class frequency/total frequency Cumulative frequency:number of values in that class or in lower Cumulative Frequency Midpoint Relative Frequency Class (67 + 78)/2 3/30 67 - 78 79 - 90 91 - 102 103 - 114 115 - 126 72.5 84.5 96.5 108.5 120.5 0.10 0.17 0.27 0.30 0.17 3 8 16 25 30 3 5 8 9 5