Download
1 / 12
160 likes | 554 Views
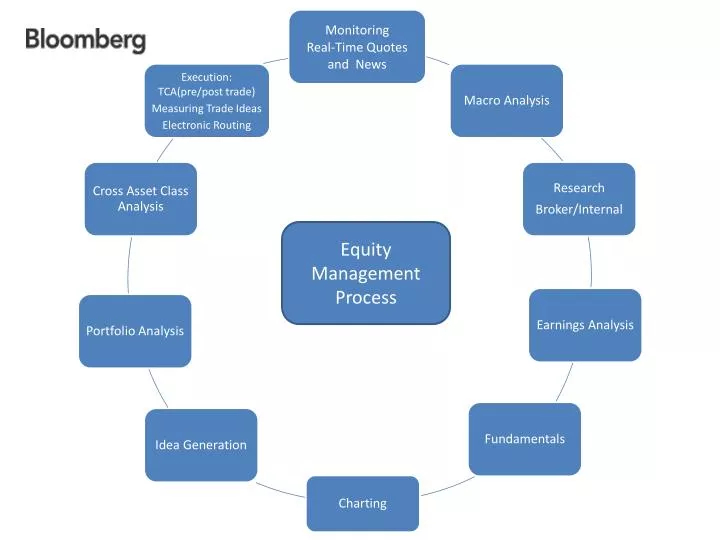
Equity Management Process. Monitoring Real Time Quotes and News.

E N D
Equity Management Process
Monitoring Real Time Quotes and News Monitor your portfolio and watch list in the most efficient way possible via Bloomberg’s latest suite of Market Monitors.Link your back office portfolios to the monitors, sort the monitor by sector, industry or country and link it to a news/research filter and advanced quoting system and charting. Use Bloomberg’s Launchpad to consolidate quotes, news, technical analysis and advanced quoting by staying abreast of breaking news stories. Simply drag and drop any of your holdings from the quotes monitor into any of the page’s components and that component or a linked components’ group will update in real time. Simply use the Launch Menu into LPAD to select your favorite components or use LLP <GO> option on almost any Bloomberg screen to make that component part of your Launchpad view.
Macro Analysis Using Bloomberg Launchpad’s Custom Function Window Manager, create and customize your top Macro Analysis screen to get ready for the morning call or market open.Simply add your favorite Bloomberg pages into a combined macro view of the world/country/economy into a simple on page screen with multiple tabs. For a complete set of functions related to macro analysis, please use CHEAT <GO> to find a complete list of key functions broken down by market participant. You can also find a completed launchpad view under BIO CONSTANTIN COSEREANU <GO> page. Simply download and save it for your own use. ECST <GO>, STAT <GO>, GSTR <GO>, ECOF <GO> some examples of where you can find key economic analytics and indicators.
Research Reports: Broker or internally generated and News Headlines/Blogs/web sites • One of Bloomberg’s key strengths lies with its news and research offerings. * 3,400 research products • 832 broker research wires • Over 25K Web sources (25.5K) –blogs and web sites scraped via proprietary web crawler. • 513 news wires including New York Times, Washington Post, Associated Press, Bloomberg’s more than 2000 reporters and more. • Content in 40 languages • More than 6400 company earnings transcripts. • All of the above available on your portfolio, lists or individual securities.
Earnings Estimates Analysis Bloomberg’s Analysts compile earnings estimates on over 17,925 Companies on a global basis. North America – 5270 Co’s. EMEA/LATAM – 5899 Co’s. Asia Pacific – 6756 Co’s. From analysts’ recommendations to earnings estimates, surprise and guidance #s and other advanced analytics on earnings, our analysts bring you the data onto an almost real-time basis. There are many nuances of consensus estimates on Bloomberg: Standard, 28 Days, Post event and Custom consensus. As of now, you can upload your own earnings estimates to Bloomberg and compare your estimates with the sell side analysts’ consensus. Using the Custom Function Manager, create your own multi-tab screens focusing on Earnings and Recommendations: ANR, BRC, EM, EEO, EEB, EEG,
Internal Research • Compare your own earnings estimates vs. the brokers’ consensus in a shared spreadsheet automatically updated and available to the investment professionals throughout the firm. This automation is based on Bloomberg’s ability to link your portfolio(s) to Excel. Brokers’ consensus #s are also available into Excel. Simply maintain your own firm’s consensus estimates in this automatically updated and refreshed spreadsheet. • Use DOCS 2054005 <Go> as an example for how portfolios can be linked into Excel. Use DOCS 2035291 <GO> as an example on how to download Estimates consensus into Excel. • Upload your own research notes, spreadsheets to Bloomberg and make them available throughout the firm to all Bloomberg users. We can create an internal wire code for your firm and make your research, spreadsheets, notes available at the stock, portfolio, list level on both the terminal as well as via the Blackberry or Bloomberg Anywhere. • Simply ask your sales representative to turn on this functionality for your firm at no extra charge.
Fundamentals Bloomberg now offers multiple flavors of fundamentals: Standardized, As Reported, Preliminary and Industry Specific Data. We cover more than 42,563 Companies on a global basis: North America – 9,872 Companies EMEA/LATAM– 13,955 Companies Asia Pacific – 18,826 Companies We now cover more than 35 industries with industry specific ratios/fundamentals – i.e. retail: Same Store Sales, Revenue per square foot; Banking: FDIC data – all call reports; Energy: Reserve per share, Reserves growth, etc. Health-care: Doctors’ surveys, trial data and much more. We also offer direct access to the source documents so that you can audit the data and see exactly where it’s coming from. Simply type IBM<Equity> FA <Go> and click on a # to see the highlighted # on the Annual or Quarterly statements. Also, via ANB <GO> you can now directly contact our data analysts in Princeton, NJ. Using the Custom Function Window Manager you can build a multi function tab to consolidate all your favorite fundamental analytics. FA, RV, PPC, GF, CF, GE, HDS, RVR, BRC and much more.
Charting: Technical studies and Fundamentals Use Bloomberg state-of-the-art technical analysis platform to determine entry/exit points for your strategies. Bloomberg now offers complete integration of charts with news, events(micro and macro), as well as research reports. Simply click on the News tab on any chart and click on point on the chart and you’ll get to the news/research reports for that day. Use GRAPH <GO> as a reference for what studies you can use in your graphs. One of the most important things related to Bloomberg charts is that you can plot any instrument that has a data series: CDS, Bonds, Commodities, Futures, indices and much more. You can also use Bloomberg’s Fundamentals’ package: GF <GO> to chart more than 20,000 fundamental fields and ratios relative to commodities, bond yields, indices or relative to other companies. GF<GO>’s “autocomplete” functionality allows you to find the fields you like. Alternatively, you could use FLDS <GO> as a means to verifying the data, as well.
Idea Generation: Screening/Scoring Bloomberg’s EQS<Go> is one of the simplest yet most sophisticated screening platforms in the world. EQS <GO> combines credit, option, and equity data in a seamless fashion.Users of EQS can use simple operators like P/E <10, P/B <1 or complex growth and/or conditional IF statements. Once you’ve identified the companies matching the criteria, you can now use our multi-factor scoring model to assign weights/importance levels to your ratios. i.e. the lower the P/E the better 20% weight, the higher the Sales Growth the better 30% weight… For users who prefer to use their own ranking methodology in EXCEL, we now can link their EQS models directly into Excel so that they can further slice and dice their output. Use =beqs(“screen name”) to link it to Excel. In times when fundamentals, credit quality and volatility play a major role in stock selection, Bloomberg’s combined multi asset coverage can make it really easy for the end user to identify the stocks matching their criteria. EQS uses standardized, As Reported and Industry Specific data. Refer to FINL<GO> for more info on our data.
Portfolio Analysis: P&L, Attribution, Risk Investment Management Firms can now use Bloomberg to generate their real-time P&L and Historical Attribution reports as well as generate ex-ante or ex-post risk reports: Tracking Error, VAR, Stress Testing are part of the basic Bloomberg package. Bloomberg’s integration team can help Investment firms link their Bloomberg terminals to their back office accounting systems in a seamless fashion at no extra cost. Once the link is in place, portfolio managers, analysts and traders can view their portfolios intra-day or historically both in the office as well as on the road via the terminal, Blackberry device or Bloomberg Anywhere. For a complete list of portfolio reports, use DOCS 2040231 or DOCS COCO <GO>. For a complete list of our white papers on our portfolio analytics, please use ALPHA <GO> portal. PRT <GO> is directly linked to our news portal so traders, PMs and analysts can see exactly what events affected their performance. BBAT <GO> is our attribution platform and constructed in accordance with CFA Institute’s GIPS Standards using the standard Brinson model to calculate performance. BRSK <GO> is our portal for the ex-ante(forecasted) risk analytics.
Cross Asset Class Analysis While Fundamental Analysis is crucial to determining the quality of an investment in the equity market, there are often cases where the value of the investment is determined from the analysis of the entire capital structure for parent and subs: corporate debt, equity, loans and preferred securities. Bloomberg is well prepared to allow users to delve into the simplest and most sophisticated analytics for performing cross asset class analytics. Using real-time CDS spreads, option implied volatility or corporate debt spreads, equity PMs, Analysts and traders can determine if a stock is undervalued or overvalued in absolute terms or relative to its peers. Whether you screen for ideas or simply want to analyze your watch list, Bloomberg’s cross asset platform allows astute users to find entry/exit points in the most innovative ways. Using Bloomberg’s Custom Function Window Manager, Bloomberg users can now build a suite of cross asset class analytics that can be accessed with the click of a button:ECCG, CXEV, CAST, DDIS, WACC, RELS, OVCR, EQS, G(charting debt, CDS, equity…and more) are just a few of the cross asset screens.
Execution and measuring trade ideas Bloomberg Execution Platform allows the trader or PM to route orders to more than 1700 destinations world wide without having to access a second trading platform. Monitor news on portfolios, perform top down or bottom up analysis and execute from your terminal and see exactly how an order’s being worked in real time. Users can now have full control of their orders from the perspective of assessing their transaction cost on a pre-trade, during trade and post-trade basis. Use the BTCA platform to set up your trade benchmarks: VWAP, Arrival price and more so that you can better assess your trade execution.By using Bloomberg’s EMSX platform, users can route their orders to the brokers of their choice or to Bloomberg’s Tradebook. To bring your trades to your back office accounting system, you can now use the Bloomberg Portfolio Order Management or AIM <GO>. To measure internally or externally generated ideas, use TMSG <GO>. This allows a buy side firm to determine which Analysts, PMs have generated the best ideas and allows buy side firms to test the validity of their sell-side ideas, as well. TMSG <GO> allows for selective access to the total view. i.e. analysts can send in their ideas and only the PM can view the results.