Download
1 / 1
10 likes | 119 Views
K. Sumner*, L. Hubley*, S. Dobrowolski*, G. Pont-Kingdon*, R. Margraf*, H. Best*†, E. Lyon*† ARUP Institute for Clinical and Experimental Pathology *, Salt Lake City, UT, Department of Pathology †, University of Utah, Salt Lake City. kelli.sumner@aruplab.com. Abstract. Exon Scanning.

E N D
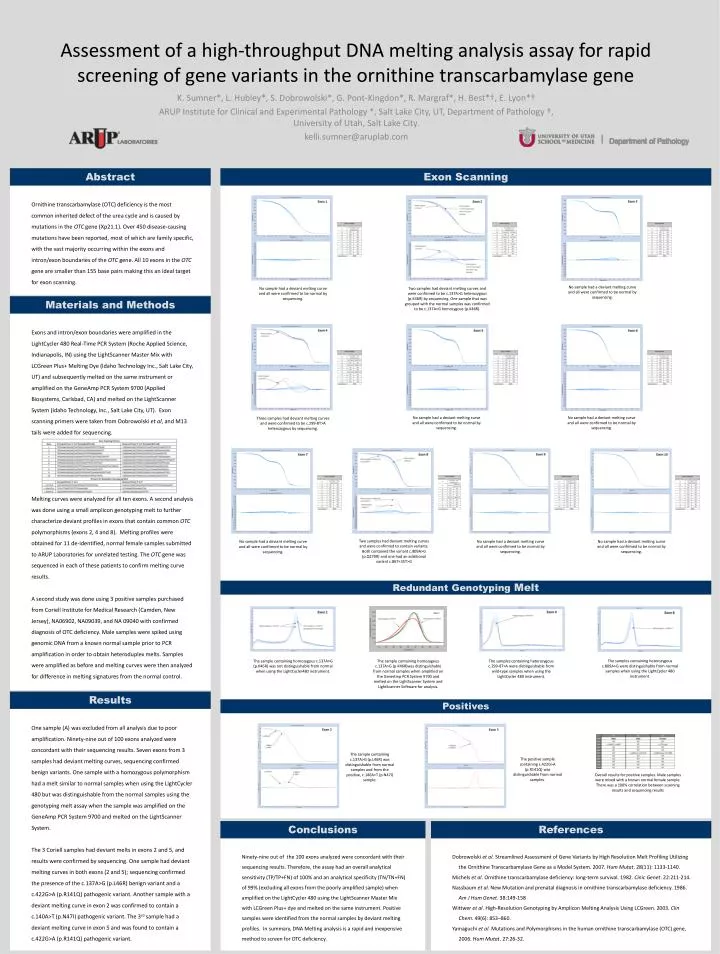
K. Sumner*, L. Hubley*, S. Dobrowolski*, G. Pont-Kingdon*, R. Margraf*, H. Best*†, E. Lyon*† ARUP Institute for Clinical and Experimental Pathology *, Salt Lake City, UT, Department of Pathology †, University of Utah, Salt Lake City. kelli.sumner@aruplab.com Abstract Exon Scanning Ornithine transcarbamylase (OTC) deficiency is the most common inherited defect of the urea cycle and is caused by mutations in the OTC gene (Xp21.1). Over 450 disease-causing mutations have been reported, most of which are family specific, with the vast majority occurring within the exons and intron/exon boundaries of the OTC gene. All 10 exons in the OTC gene are smaller than 155 base pairs making this an ideal target for exon scanning. No sample had a deviant melting curve and all were confirmed to be normal by sequencing. No sample had a deviant melting curve and all were confirmed to be normal by sequencing. Two samples had deviant melting curves and were confirmed to be c.137A>G heterozygous (p.K46R) by sequencing. One sample that was grouped with the normal samples was confirmed to be c.137A>G homozygous (p.K46R). Assessment of a high-throughput DNA melting analysis assay for rapid screening of gene variants in the ornithine transcarbamylase gene Materials and Methods Exons and intron/exon boundaries were amplified in the LightCycler 480 Real-Time PCR System (Roche Applied Science, Indianapolis, IN) using the LightScanner Master Mix with LCGreen Plus+ Melting Dye (Idaho Technology Inc., Salt Lake City, UT) and subsequently melted on the same instrument or amplified on the GeneAmp PCR System 9700 (Applied Biosystems, Carlsbad, CA) and melted on the LightScanner System (Idaho Technology, Inc., Salt Lake City, UT). Exon scanning primers were taken from Dobrowolski et al, and M13 tails were added for sequencing. Melting curves were analyzed for all ten exons. A second analysis was done using a small amplicon genotyping melt to further characterize deviant profiles in exons that contain common OTC polymorphisms (exons 2, 4 and 8). Melting profiles were obtained for 11 de-identified, normal female samples submitted to ARUP Laboratories for unrelated testing. The OTC gene was sequenced in each of these patients to confirm melting curve results. A second study was done using 3 positive samples purchased from Coriell Institute for Medical Research (Camden, New Jersey), NA06902, NA09039, and NA 09040 with confirmed diagnosis of OTC deficiency. Male samples were spiked using genomic DNA from a known normal sample prior to PCR amplification in order to obtain heteroduplex melts. Samples were amplified as before and melting curves were then analyzed for difference in melting signatures from the normal control. No sample had a deviant melting curve and all were confirmed to be normal by sequencing. No sample had a deviant melting curve and all were confirmed to be normal by sequencing. Three samples had deviant melting curves and were confirmed to be c.299-8T>A heterozygous by sequencing. Two samples had deviant melting curves and were confirmed to contain variants. Both contained the variant c.809A>G (p.Q270R) and one had an additional variant c.867+35T>G No sample had a deviant melting curve and all were confirmed to be normal by sequencing. No sample had a deviant melting curve and all were confirmed to be normal by sequencing. No sample had a deviant melting curve and all were confirmed to be normal by sequencing. RedundantGenotyping Melt The samples containing heterozygous c.809A>G were distinguishable from normal samples when using the LightCycler 480 instrument. The sample containing homozygous c.137A>G (p.K46R) was not distinguishable from normal when using the LightCycler480 instrument. The sample containing homozygous c.137A>G (p.K46R)was distinguishable from normal samples when amplified on the GeneAmp PCR System 9700 and melted on the LightScanner System and LightScanner Software for analysis. The samples containing heterozygous c.299-8T>A were distinguishable from wild-type samples when using the LightCycler 480 instrument. Results Positives One sample (A) was excluded from all analysis due to poor amplification. Ninety-nine out of 100 exons analyzed were concordant with their sequencing results. Seven exons from 3 samples had deviant melting curves, sequencing confirmed benign variants. One sample with a homozygous polymorphism had a melt similar to normal samples when using the LightCycler 480 but was distinguishable from the normal samples using the genotyping melt assay when the sample was amplified on the GeneAmp PCR System 9700 and melted on the LightScanner System. The 3 Coriell samples had deviant melts in exons 2 and 5, and results were confirmed by sequencing. One sample had deviant melting curves in both exons (2 and 5); sequencing confirmed the presence of the c.137A>G (p.L46R) benign variant and a c.422G>A (p.R141Q) pathogenic variant. Another sample with a deviant melting curve in exon 2 was confirmed to contain a c.140A>T (p.N47I) pathogenic variant. The 3rd sample had a deviant melting curve in exon 5 and was found to contain a c.422G>A (p.R141Q) pathogenic variant. The sample containing c.137A>G (p.L46R) was distinguishable from normal samples and from the positive, c.140A>T (p.N47I) sample. The positive sample containing c.422G>A (p.R141Q) was distinguishable from normal samples. Overall results for positive samples. Male samples were mixed with a known normal female sample. There was a 100% correlation between scanning results and sequencing results Conclusions References Ninety-nine out of the 100 exons analyzed were concordant with their sequencing results. Therefore, the assay had an overall analytical sensitivity (TP/TP+FN) of 100% and an analytical specificity (TN/TN+FN) of 99% (excluding all exons from the poorly amplified sample) when amplified on the LightCycler 480 using the LightScanner Master Mix with LCGreen Plus+ dye and melted on the same instrument. Positive samples were identified from the normal samples by deviant melting profiles. In summary, DNA Melting analysis is a rapid and inexpensive method to screen for OTC deficiency. Dobrowolski et al. Streamlined Assessment of Gene Variants by High Resolution Melt Profiling Utilizing the Ornithine Transcarbamylase Gene as a Model System. 2007. Hum Mutat. 28(11): 1133-1140. Michelset al. Ornithine transcarbamylase deficiency: long-term survival. 1982. Cinic Genet. 22:211-214. Nassbaumet al. New Mutation and prenatal diagnosis in ornithine transcarbamylase deficiency. 1986. Am J Hum Genet. 38:149-158 Wittwer et al. High-Resolution Genotyping by Amplicon Melting Analysis Using LCGreen. 2003. Clin Chem. 49(6): 853–860. Yamaguchi et al. Mutations and Polymorphisms in the human ornithine transcarbamylase (OTC) gene, 2006. Hum Mutat. 27:26-32.