Download
1 / 40
400 likes | 605 Views
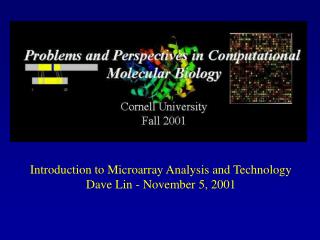
Introduction to Microarray Analysis and Technology Dave Lin - November 5, 2001. Overview. Why Biologists care about Genomics. Why statisticians/computer scientists may care about genomics Preprocessing issues Sources of variability in constructing microarrays Postprocessing issues

E N D
Introduction to Microarray Analysis and Technology Dave Lin - November 5, 2001
Overview • Why Biologists care about Genomics • Why statisticians/computer scientists • may care about genomics • Preprocessing issues • Sources of variability in constructing • microarrays • Postprocessing issues • Analysis of data
What makes one cell different from another? liver vs. brain Cancerous vs. non-cancerous Treatment vs. control
Old Days 100,000 genes in mammalian genome each cell expresses 15,000 of these genes each gene is expressed at a different level estimated total of 100,000 copies of mRNA/cell 1-5 copies/cell - “rare” -~30% of all genes 10-200 copies/cell - “moderate” 200 copies/cell and up - “abundant”
Cells can be defined by: Complement of Genes (which genes are expressed) How much of each gene is expressed (quantity) What makes one cell different from another? Try and find genes that are differentially expressed Study the function of these genes Find which genes interact with your favorite gene Extremely time-consuming. Huge amounts of effort expended to find individual genes that may differ between two conditions
Genomics. Almost useless term-defines many different concepts and applications. Microarrays -massively parallel analysis of gene expression -screen an entire genome at once -find not only individual genes that differ, but groups of genes that differ. -find relative expression level differences -how quantitative can they be?
Microarrays- Based on old technique many flavors- majority are of two essential varieties cDNA Arrays printing on glass slides miniaturization, throughput fluorescence based detection Affymetrix Arrays in situ synthesis of oligonucleotides will not consider Affymetrix arrays further.
Building the Chip: PCR PURIFICATION and PREPARATION MASSIVE PCR Full yeast genome = 6,500 reactions IPA precipitation +EtOH washes + 384-well format PRINTING The arrayer: high precision spotting device capable of printing 10,000 products in 14 hrs, with a plate change every 25 mins PREPARING SLIDES Polylysine coating for adhering PCR products to glass slides POST PROCESSING Chemically converting the positive polylysine surface to prevent non-specific hybridization
Fabrication of “Spotted Arrays” 20,000 Precipitations 20,000 PCR reactions ArrayedLibrary Normalized/Subtracted Consolidate for printing 20,000 resuspensions Spot on Glass Slides
Hybing the Chip: ARRAY HYBRIDIZATION Cy3 and Cy5 RNA samples are simultaneously hybridized to chip. Hybs are performed for 5-12 hours and then chips are washed. DATA ANALYSIS Ratio measurements are determined via quantification of 532 nm and 635 nm emission values. Data are uploaded to the appropriate database where statistical and other analyses can then be performed. PROBE LABELING Two RNA samples are labelled with Cy3 or Cy5 monofunctional dyes via a chemical coupling to AA-dUTP. Samples are purified using a PCR cleanup kit.
Labeling of RNAs with Cy3 or Cy5 Two general methods -Dye conjugated nucleotide -Amino-allyl indirect labeling
Direct labeling of RNA RNA AAAAAAA cDNA TTTTTTTT CCAACCTATGG T Cy5-dUTP + or cDNA synthesis T Cy3-dUTP GGTTGGATACC
Indirect labeling of RNA AAAAAAA TTTTTTTT CCAACCTATGG T Modified nucleotide cDNA synthesis GGTTGGATACC Cy3 GGTTGGATACC addition
Dye effect issues Direct method Unequal incorporation of Cy5 vs. Cy3 Very poor overall incorporation of direct-conjugated nucleotide = more starting RNA for labeling. Indirect method Presumably less bias in initial incorporation of activated nucleotide, but not clear if more or less dye is added Both Methods Cy3 fluoresces more brightly than Cy5 labeling is very highly sequence dependent
Micrograph of a portion of hybridization probe from a yeast mciroarray (after hybridization).
77 pg1 pg2 Layout of the cDNA Microarrays • Sequence verified, normalized mouse cDNAs • 19,200 spots in two print groups of 9,600 each • 4 x 4 grid, each with 25 x24 spots • Controls on the first 2 rows of each grid.
Practical Problems 1 • Comet Tails • Likely caused by insufficiently rapid immersion of the slides in the succinic anhydride blocking solution.
Practical Problems 3 High Background • 2 likely causes: • Insufficient blocking. • Precipitation of the labeled probe. Weak Signals
Practical Problems 4 Spot overlap: Likely cause: too much rehydration during post - processing.
Practical Problems 5 Dust
Pin-specific printing differences
Normalization - lowess • Global lowess • Assumption: changes roughly symmetric at all intensities.
Normalisation - print-tip-group Assumption:For every print group, changes roughly symmetric at all intensities.
Pre-processing Issues -Definition of what a real signal is what is a spot, and how to determine what should be included in the analysis? -How to determine background local (surrounding spot) vs. global (across slide) -How to correct for dye effect -How to correct for spatial effect e.g. print-tip, others -How to correct for differences between slides e.g. scale normalization
Experimental Design Issues What is the best means of performing the experiment To obtain the desired answer? Biologists’ assumptions and statisticians’ differ. Biologist viewpoint make everything exactly the same so that differences will stand out Statistician viewpoint make everything as random as possible so that real trends will stand out
Most biologists will ask- what are the differences between two samples? -implicit questions associated with microarrays- What is the best way to determine this? e.g. Design; replicates; conditions. How do I obtain the most reliable results? e.g. measurements, normalization How do I determine what a significant difference is? Do I care about “subtle” changes, or just the extremes? How is information best extracted? Is correlation useful? What type of clustering? How is information combined? How do you model the interactions of 1000s of genes
Advantages of Our Design • Lower variability • Increased precision • Increase in measurement of expression -> increased precision