Download
1 / 37
370 likes | 603 Views
High Mass Star Formation from an Extragalactic Prospective. Gerhardt R. Meurer International Centre for Radio Astronomy Research University of Western Australia. High Mass Star formation tracers SINGG & SUNGG Surveys Why study extragalactic HMSF? Results The Star Formation Law

E N D
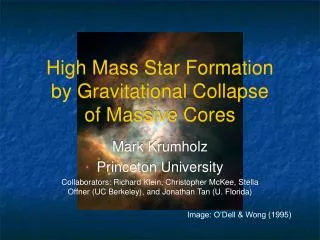
High Mass Star Formation from an Extragalactic Prospective Gerhardt R. Meurer International Centre for Radio Astronomy Research University of Western Australia
High Mass Star formation tracers • SINGG & SUNGG Surveys • Why study extragalactic HMSF? • Results • The Star Formation Law • The Initial Mass Function • Modes of star formation • Take home points Outline
Ha vs. FUV Mu = 100 MsunUVHa Mu = 30 Msun UVHa • H • traces O stars • M* > ~20 Msun • t < ~7 Myr • Vacuum UV • traces O and B stars • M* > ~3 Msun • B stars dominate • Dominates emitted spectrum of star forming regions • t < ~ 300 Myr Starburst99 CSFR models (Leitherer et al 1999, ApJS, 123, 3)
Dust reprocessing • IRX-b: dust absorption correlates with UV colour • Requires that much of dust is in a foreground screen or shell near SF • Allows crude dust correction • Different relationships for starburst and normal galaxies Wong et al. (2010 in prep…) Gil de Paz et al. (2007, ApJS, 173, 185) Meurer et al. (1999, ApJ, 521, 64)
Other HMSF tracers Mid-IR Radio continuum • Strong linear Radio – FIR correlation • neither trace HMSF well at low L • FIR + FUV should trace HMSF well • Bell (2003, ApJ, 586, 794) 2483.6 • 24mm + Ha trace O stars • 8mm (PAH) not as good HMSF tracer • Calzetti et al. (2007, ApJ, 666, 870)
HIPASS, SINGG, and SUNGG HI Parkes All Sky Survey (HIPASS) HI 21cm Parkes 64m 4315 sources Survey of Ionization in Neutral Gas Galaxies (SINGG) Ha & R band CTIO 1.5m 468 sources selected 331 observed Survey of Ultraviolet emission in Neutral Gas Galaxies (SUNGG) FUV & NUV Galex 0.5m 139 selected ~200 observed
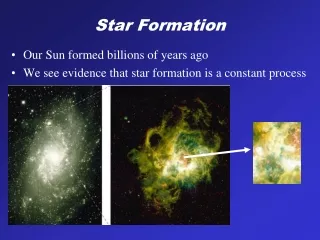
All HI galaxies are forming stars Multiple emission line galaxies common Diverse morphologies Some results Meurer et al. 2006, ApJS, 165, 307 Hanish et al. 2006, ApJ, 649, 150
Why study extragalactic HMSF? • Obvious reasons: • Avoid galactic plane • Known distance • Sample large ranges of • Gas densities • Abundance • Radiation intensity (extremes esp. important) • HMSF useful for • Highlighting dynamics • Finding companions • …the most luminous galaxies • ..the most distant galaxies • Tracing cosmic evolution Probe Physics of HMSF!
Highlighting dynamics with HMSF • NIR: stellar mass distribution • Ha: better defined usually • UV: often washed out, but outer disks light up
Finding companion galaxies HIPASS J2149-60 HIPASS J1059-09
The most luminous galaxies Arp220 HST/ACS • Ultra-Luminous Infrared Galaxies (ULIRGs) • Lbol > 1012 Lsun • Highly dust extincted • Usually disturbed or interacting • Hyper-Luminous Infrared Galaxies • Lbol > 1013 Lsun • Mostly known at z > 1 • Often contain AGN • Disturbed morphology HST/NICMOS Farrah et al. (2002, 329, 605)
The most distant galaxies • Lyman Break Galaxies • z > ~1 • Need a rest frame UV spectrum dominated by HMSF • z ~ 8 is state of the art • Can also select in • Rest frame FIR • Radio Dickinson (1998, astro-ph/9802064) Bouwens et al. (2010, ApJL, 709, L133)
Tracing cosmic evolution • HMSF as shorthand for galaxy evolution • Over 10x decline since z~1.5 (~7 Gyr ago) • Fuel running out? • Less accretion? • SFRD from Ha and UV differ Hopkins & Beacom (2006, ApJ, 651, 142)
Definition: the SFR (Msun/year) given the properties of the ISM • Schmidt (1959, ApJ, 129, 243) SFR∝ gn; n ~ 2 • Kennicutt (1989, ApJ, 344, 685; 1998, ApJ, 498, 541; Martin & Kennicutt 2001, ApJ, 555, 301) SFR∝ gN ; N ~ 1.4 when g > c =Q Q = /(pSgG) disk stability =epicyclic frequency The Star Formation Law
Kennicutt (1998) global SFL • Global • And galaxy centers • sSFR ~ 0.4 dex
SSFR ~ SH2 (N = 1.0) g Linear relation between molecular gas and SFR Rmol = SH2/SHI ~ S*g molecular fraction set by hydrostatic pressure Q(2 Fluids) ~ constant gISM disks maintained at constant stability Leroy et al. (2008, AJ, 136, 2782) , Bigiel et al. (2008, AJ, 136, 2846) THINGS SFL results
Ha/HIgSFR/HIgH2/HIgRmolgP(!) Expect 1:1 correlation with SR Test with SINGG global fluxes • X-axis SFRR • rxy 0.76 -0.80 • Slope 0.71 0.89 • y 0.28 0.27 • x 0.40 0.30
Tighter than the Kennicut SFL • From optical observations can estimate HI content to better than a factor of 2 • Good physical understanding of the results • Star formation in the molecular phase of a pressure regulated disk near critical stability • Stellar disk important for setting the equilibrium pressure SFL Implications
SF edges not always seen in UV (e.g. Thilker et al. 2005, ApJ, 619, L79) SFR(UV) traces HI at very low Sg (Bigiel et al. 2010, ApJ, 720, L31) Some SFL complications from M83…
Definition: the mass distribution of stars formed in a single event • The argument for a constant IMF: • Same Salpeter IMF slope seen where it can be measured well - populous star clusters (Kroupa 2001, MNRAS, 322, 231) • All stars form in star clusters (Lada & Lada, 2003, ARA&A, 41, 57) • (later they disperse…) The Initial Mass Function Log(N) (g =G -1)
Ranges by a factor of 10 Strongly correlates with optical surface brightness Most galaxies below expectations for Salpeter (or Kroupa) IMF From FUV data: all galaxies should have multiple O stars (Meurer et al. 2009, ApJ, 695, 765) The Ha/FUV ratio & the IMF
A. Low FH/fFUV • HIPASS J0249-02 • log (FH/fFUV) = 0.51 • log(SFR,H) = -3.28 • log(R/R,sun) = 6.87 • UGCA44 • IB(s)m: • log(MHI/Msun) = 8.85 • log(LR/LR,sun) = 8.29
B. High FH/fFUV • HIPASS J0419-54 • log(FH/fFUV) = 1.33 • log(SFR,H) = -1.21 • log(R/R,sun) = 8.70 • NGC1566 • SAB(rs)bc • log(MHI/Msun) = 10.19 • log(LR/LR,sun) = 11.09
Models of effects of bursting and gasping SFH CSFR + Gaussian increase (burst) or decrease (gasp) in SFR Max/min SFR: 2,10, 100 FWHM = 10, 100, 1000 Myr Effect of Star Formation History
Perhaps low Ha/FUV points are due to escaping ionizing radiation • Direct measurements of escape fraction have only been attempted in HSB starbursts • However • LSB galaxies are gas rich • Would require naked O stars • O stars not seen or rare in CMDs of nearby LSB dwarfs (e.g. Tolstoy 1996, ApJ, 462, 684; Young et al. 2007, ApJ, 659, 331) • But are seen in CMDs of higher SB irregulars (e.g. Annibali et al. 2008, AJ, 135, 1900) Escaping ionizing radiation?
SFH / leaking HII regions from CMDs Phoenix dI (Young et al. 2007) NGC4449 (Annibali et al. 2008)
Related results • Buat et al. (1987, A&A, 185, 33) use UV + Ha to suggest possibility of IMF variations in nearby galaxies. • Outer disks Ha edges not so apparent in UV (Thilker et al 2005, ApJ, 619, L79; Thilker et al. ApJS, 2007, 173, 578; Boissier et al. 2007, ApJS, 173, 524) • Hoversten & Glazebrook (2008, ApJ, 675, 163)use EW(Ha) versus g-r (SDSS) to infer variable IMF. • Lee et al. (Lee et al. 2009, ApJ, 706, 599) similar results for 11 HUGS
Field versus cluster • About 60% of Ha is diffuse (Oey et al. 2007, AJ, 661, 801) • >~80% of UV is diffuse (Meurer et al. 1995, AJ, 110, 2665; Larsen 2004, A&A, 416, 537)
Field: deficient in O stars • Spectrum dominated by B stars (Tremonti et al. 2001, ApJ, 555, 322) • Low Ha/FUV (Hoopes et al. 2001, ApJ 559, 878)
Two modes of star formation (Meurer et al. 1995, AJ 110, 2665) • Bound clusters - prominent • Diffuse star formation - dominant (groups, associations, star clouds) • Lada & Lada (2003) is misleading • Based on expansive redefinition of “cluster” to include unbound objects (groups, associations) • Recent results on Galactic YSOs: (Bresert et al. 2010, MNRAS, arXiv:1009.1150) • Stars form over a wide of densities • No clear field vs. cluster distinction • 26% of YSOs in dense clusters Stars don’t form just in clusters
Our scenario • Highest mass stars form in bound clusters (Bonnell et al. 2003, MNRAS, 343, 413; 2004, MNRAS, 349, 735; Bonnell & Bate, 2006, MNRAS, 370, 488) • Bound clusters form in dense mol ISM • Hydrostatic pressure determines molecular fraction (McKee & Ostriker 1977, ApJ, 218, 148; Wolfire et al. 2003, ApJ,, 587, 278; Blitz & Rosolowsky 2006, ApJ, 650, 933) • Pressure also determines how well bound star clusters are when formed (Elmegreen & Efremov 2007, ApJ, 280, 235; Elmegreen 2008, ApJ, 672, 1006) • Stars dominate disk plane potential and set hydrostatic pressure • Hence we have the surface brightness IMF correlation: S*g P g cluster/field g O/B g Ha/FUV • Consistent with cluster fraction versus surface brightness (Meurer et al. 1995, AJ, 110, 2665; Larsen 2004, A&A, 416, 537)
HMSF useful for tracing galaxy evolution at all redshifts • Results depend on tracer: • Ha (Pa, …, 24 mm) traces the most massive (O) stars, formed in: • Tightly bound clusters • Starbursts • Spiral density waves • UV (FIR, radio) sensitive to lower mass (O + B) stars: formed in: • Clusters or field • Outer disks • IMF varies within and between galaxies • S* is a key parameter for setting SF intensity and effective IMF • Probably by setting the hydrostatic P of the ISM Take Home Messages
HMSF Tracers: Ha and FUV Spectrum of starburst galaxy NGC1705 (Meurer et al. 1992, AJ, 103, 60) Ultraviolet Optical FUV Ha Wavelength [Angstroms]
SINGG SFL results • X-axis pseudo HIR • rxy 0.59 0.75 • slope 1.66 1.01 • y 0.50 0.29 • x 0.30 0.29 (cf Dopita & Ryder 1994, ApJ, 430, 163) Older populations also important for star formation regulation
Correlations with tgas ~ 2.3MHI/SFR • X-axis SFRR • rxy -0.75 -0.77 • slope -0.77 -0.87 • y 0.26 0.28 • x 0.33 0.32