Download
1 / 36
360 likes | 482 Views
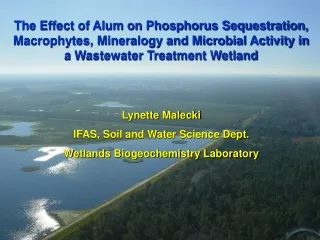
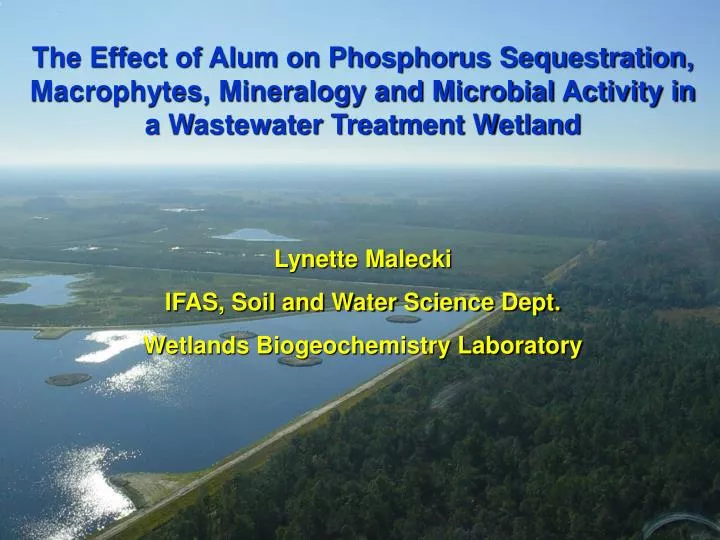
The Effect of Alum on Phosphorus Sequestration, Macrophytes, Mineralogy and Microbial Activity in a Wastewater Treatment Wetland. Lynette Malecki IFAS, Soil and Water Science Dept. Wetlands Biogeochemistry Laboratory. Iron Bridge WWTF. St. Johns Rv. Orlando. OEW. OEW Facts.

E N D
The Effect of Alum on Phosphorus Sequestration, Macrophytes, Mineralogy and Microbial Activity in a Wastewater Treatment Wetland Lynette Malecki IFAS, Soil and Water Science Dept. Wetlands Biogeochemistry Laboratory
Iron Bridge WWTF St. Johns Rv. Orlando OEW OEW Facts • 1,200 acre wetland constructed in 1986 • 17 cells, 32 water control structures • Treats 35 mgd from Iron Bridge Wastewater Treatment Plant
17 13 7 14 3 8 16A 4 1 9 5 16B 2 10 6 11 15 12 410 ac. Deep marsh 380 ac. Mixed marsh 310 ac. Hardwood swamp Project Location Outflow 17 17 13 13 7 7 14 14 3 3 8 8 16A 16A 4 4 1 1 9 9 5 5 16B 16B 2 2 10 10 6 6 Inflow Inflow 11 11 15 15 12 12
. . Outflow Outflow North North Central Central Inflow Inflow Permit limits: Permit limits: South South TP 0.2 mg/L TP 0.2 mg L-1 TN 2.31 mg/L TN 2.31 mg L-1 Flow Trains
0.6 Inflow TP Outflow TP 0.5 0.4 TP (mg L-1) 0.3 0.2 0.1 0.25 0.25 New permit Former SJRWMD threshold limit Former permit limit limit 0.0 0.20 0.20 New limit Jan-96 Jan-97 Jan-98 Jan-99 Jan-00 Jan-01 Jan-02 Jan-03 TP (mg L-1) 1 1 0.15 0.15 - - mg TP L mg TP L 0.10 0.10 0.05 0.05 0.00 0.00 Jan Jan - - 98 98 Jan Jan - - 99 99 Jan Jan - - 00 00 Jan Jan - - 01 01 Jan Jan - - 02 02 Jan Jan - - 03 03 The Problem Concern over P binding capacity
Management Strategies • Prescribed burning • Cell 1,3,8,9,10 • Dredging • Cell 1,3,4,7,8 • Chemical amendments
Alum (Al2(SO4)3•14H2O) • pH of 2.4 • Dissociates in water forming Al3+ ions that are immediately hydrated: • Al3+ + H2O Al(OH)2+ + H+ • Al(OH)2+ + H20 Al(OH)2+ + H+ • Al(OH)2+ + H20 Al(OH)3(s) + H+ • For P inactivation need system pH 6 to 8
Alum Alternatives • PAC (Aln(OH)mCl(3n-m)) • Stronger highly charged polymers, faster settling flocs • pH buffer is not needed • 2.5 times more expensive • PNAS • Add powdered calcium carbonate to concentrated alum • 0.1 times more expensive • Alum residual • free from water treatment plants • heavy metal content • seed bank
Aluminum Toxicity • Toxic to fish • Lose ability to maintain osmoregulatory balance and respiratory problems (Baker, 1982) • Toxic to benthos • Decreased benthic biodiversity and density, floc interferes with movement and feeding (Smeltzer, 1990 and 1999)
Aluminum Toxicity • Toxic to plants • Disrupts structure and function of plasma membrane • Inhibits ATP and DNA synthesis • Inhibits root elongation • Results in P, Ca, and Mg deficiencies
Case Studies • Mirror Lake, WI (Garisson and Knauer, 1984) • Urban storm drainage diverted in 1976 • Severe blue-green blooms and internal loading • 1978 alum applied (6.6 mg Al L-1) • Water column TP decrease 90 μg L-1 to 20 μg L-1 • Treatment lasted through 1991 (TP< 40 μg L-1 ) • Eau Galle Reservoir, WI (Barko et al., 1990) • High external and internal loading • 1986 Dose = 5 yrs * avg summer internal load • Effective for one summer • P inactivation ineffective when external loading remains high
Case Studies • Wapato Lake, WA (Welch and Schrieve, 1994) • Residential and commercial storm water • High turbidity, algal blooms, dense Ceratophyllum • 1984 alum (7.8 g Al m-3) • TP reduced for one month • Increase in plant biomass and pH increased to 10.1 • TP increased 24% due to sediment P release and plant senescence
Hypotheses • Alum will effectively sequester P in a municipal treatment wetland. • Alum will decrease the growth and nutrient uptake of aquatic macrophytes. • There will be a decline in biomass and activity of the microbial community. • Changes in mineralogy will be evident due to the alum application.
Objectives I. Determine the effectiveness of: • Alum treatment in the OEW • Alum, alum residual, PAC, and PNAS
Objectives II. Determine the effects of alum on: • Aquatic macrophytes • P cycling / microbial activity • Mineralogy • Water column and soil Al speciation
Tri-Scale Experiment Laboratory and Core Incubation Studies Mesocosms Paired Cell Field Experiment
Proposed Bioreactor Studies • Alum dosage variable, pH constant • pH variable, alum dosage constant 4 6 8 3 5 9 Patrick et al., 1973
Proposed Core Study • Effectiveness of alum, alum residual, PAC, and PNAS vs. control • P flux into water column • Al speciation in water column • Effect on soil P fractions and Al fractions • Soil microbial characteristics • Change in water column and soil pH
Proposed Mesocosm Study • Effect of alum on cattails, bulrush, and SAV • P flux into water column • Al speciation in water column • Effect on soil P fractions and Al fractions • Soil microbial characteristics • Change in water column and soil pH
9 5 10 6 Proposed Paired Cell Field Study • Alum treated vs. control cell • Monitor inflow and outflow TP, Al, and pH • Collect multiple intact cores (0, 3, 6, 9, 12, 18, 24 mo.) • Soil characterization • Al and P fractionation • Mineralogical composition analysis • Plant biomass and nutrient uptake
Methods I. • Soil and water column pH • Total inorganic P (Reddy et al., 1998) • Total P, L.O.I. (Anderson, 1976) • Inorganic P fractionation (Psenner et al., 1984; Reddy et al., 1998) • Microbial biomass P (Ivanoff et al., 1998; Brookes et al., 1985) • Sediment Oxygen Demand (SOD) (Fisher and Reddy, 2001) • Potentially mineralizable P (PMP) (White and Reddy, 2000) • Al fractionation (Srinivasan and Viraraghavan, 2002; Bertsch, 1990) • Ammonium oxalate and citrate-dithionate Al extraction
Methods II. • Plant productivity and biomass (Davis, 1984 ; Madsen, 1993) • TP, TN, Al, Ca, Mg plant tissue analysis (Allen et al., 1974; James et al., 1983) • Particle size fractionation and X-ray diffraction analysis • Thermogravimetric weight loss (Karathanasis and Harris, 1994) • Density separations and SEM
Data Analysis • Kolmogorov-Smirnov normality test (α = 0.05) • Bartlett’s test for equal variance • ANOVA to determine differences in parameters with Tukey’s W multiple comparison procedure • Paired student t-tests (α = 0.05 ) between depth intervals • Pearson product-moment correlation coefficients (α = 0.05) between parameters • Regression analysis of necessary relationships
Anticipated Results • Alum will work effectively in sequestering P in a treatment wetland, however will the longevity of the treatments effectiveness persist? • Will the microbial biomass and activity only be affected in the short term? • Will alum affect the macrophytes and mineralogy of the soil in both the short and long term?
Research Implications • Usefulness of alum as a wetland management technique • Possible future use of PAC or PNAS in natural systems • Stimulate similar research in lake systems
pH 1.0 (2 h) Total Al (Al ) T Suspended Al (Al ) ss (Al ) - (Al ) T (C+D) Filter, pH 1.0 (2 h) Colloidal and 50 mL DI (1 h) Dried dissolved Al (Al ) Ground Soil (C+D) Colloidal Al (Al ) C (Al ) - (Al ) (C+D) (I+O) Filter Filter Dissolved Al (Al ) (I+O) Cation Exchange Resin Inorganic Al (Al ) I (Al ) - (Al ) (I+O) O Organic Al (Al ) O Al Speciation Adapted from (Srinivasan and Viraraghvan, 2002; Yamada et al, 2002)
Dose Determination Methods • Titrate water samples of different alkalinities with alum to a pH of 6.0 (Kennedy and Cooke, 1982) • Dose = 2(average summer internal P load * target period) (Kennedy et al., 1987) • Test different doses (1.4-21.8 g kg-1) on 5 g air-dried soil + 25 mL DDI shaken for 3 days and analyzed for SRP (Ann, 1995) • Determine the amount of mobile P (labile and Fe-P) in the upper 4-10 cm and multiply by 100:1 ratio of Al added: Al-P formed (Rydin and Welch, 1999)
POP DOP SRP POP DOP SRP Phosphorus Cycle Inflow Outflow Ca/Mg/Fe/Al-P Recalcitrant P
Soil 1 M KCl (2 hrs) Readilyavailable Pi Residue 0.1 M NaOH (17 hrs) 0.11M NaHCO3 / 0.11M Na2S2O4 (1 hr) Fe - bound PI Alkali extractable Po (TP-SRP) Al - bound Pi Residue 0.5 M HCl (24hrs) Residue Ca / Mg - bound Pi Residual P (Po) Inorganic P Fractionation Adapted from (Rydin ey al., 2000; Reddy, K. R. et al., 1998; Psenner et al., 1988; Psenner et al., 1984)
Materials Average OEW Cell 10 soil characterization (0-4 cm): • 50-60% organic matter • Soil pH 5.0-6.0 • 10 g kg-1 Ca • 170 mg kg-1 Al/Fe-bound P Samples Used: • OEW1 = 812 g m-2 (14.4 ppm)powder alum • OEW2 = 406 g m-2 (7.2 ppm)powder alum • OEW3 = 406 g m-2 (7.2 ppm)liquid alum
Methods • Samples were air dried, crushed with mortar and pestle. • Mini 270 sieve to separate sand from silt and clay • Side powder mounts of silt + clay fraction • Silt and clay separated via pH 10 water centrifugation • Side powder mounts of silt fraction • Clay tiles or quartz aluminum mounts of clay fraction
OEW 1 Silt + Clay d=7.21