Download
1 / 39
390 likes | 490 Views
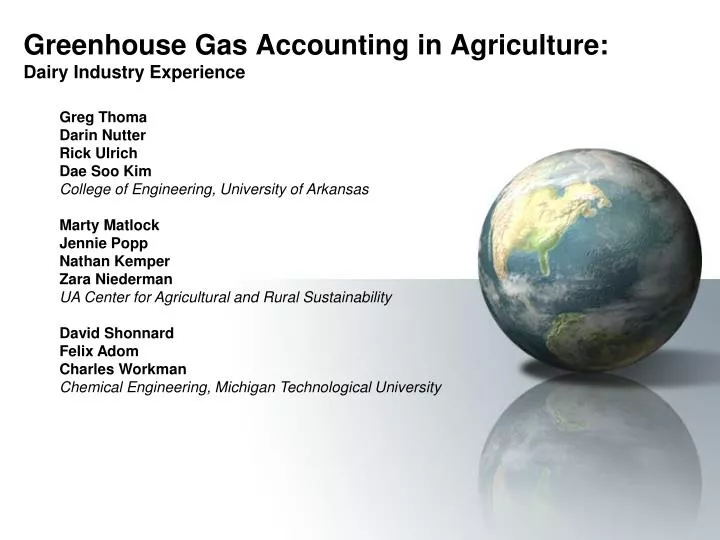
Greenhouse Gas Accounting in Agriculture: Dairy Industry Experience. Greg Thoma Darin Nutter Rick Ulrich Dae Soo Kim College of Engineering, University of Arkansas Marty Matlock Jennie Popp Nathan Kemper Zara Niederman UA Center for Agricultural and Rural Sustainability David Shonnard

E N D
Greenhouse Gas Accounting in Agriculture:Dairy Industry Experience Greg Thoma Darin Nutter Rick Ulrich Dae Soo Kim College of Engineering, University of Arkansas Marty Matlock Jennie Popp Nathan Kemper Zara Niederman UA Center for Agricultural and Rural Sustainability David Shonnard Felix Adom Charles Workman Chemical Engineering, Michigan Technological University
Why an LCA of Milk Production? Consumers are interested in product sustainability. Increasing willingness to make purchase decisions based on (perceived) environmental impacts. Potential for reduction in consumption of dairy. Science-based LCA can provide: Data that will allow the industry to identify and engage more sustainable approaches Reduce environmental impacts that can be validated through LCA measurements. Other benefits: Systems understanding allows positioning dairy products in the marketplace based on sustainable attributes respond proactively to consumer concerns. Supports industry’s ability to work with retailers to educate consumers about agricultural and food sustainability issues. Establish a baseline for GHG offset projects which may result from legislation in the future
LCA MethodologyISO 14044 compliant Goal: Determine GHG emissionsassociated with consumption of one gallon of milk to US consumer. Scope: Cradle to grave. Specifically including pre-combustion burdens for primary fuels and disposal of packaging. National Scale Analysis – drives data collection
Global Warming Potential of Fluid MilkScope: grass to glass Consumer/ End of Life Waste & Pollution Resources&Energy
Life Cycle Inventory – Data Drives the Work • Surveys: • Dairy Producer (~535; 9% response rate) • Farm to processor transportation data (~150,000 round trips – 2007 only) • Milk Processor (50 plants responded) • Published Literature: • Peer Reviewed Literature • Enteric Methane, Nitrogen and Methane from manure management • Life cycle inventory data for crop production (NASS, Budgets, USLCI) • Other Publications (e.g. IPCC, EPA) • Expert opinion
Dairy Feed: crop production Fertilizer, pesticides, fuel & processing
Calculating Feed Footprint: Data Sources • NASS data on fertilizers, fuels, pesticides and other inputs • States with complete data averaged • CO2e burden of inputs accounted • Production burdens and N2O from field accounted • Production budgets from state Ag extension agents used for silage, hay, and pasture • Budget prices converted to estimated quantities • Similar accounting: state budgets aggregated and CO2e accounted
Data Challenges • Incomplete data sets • Fertilizer type by crop, pesticides, fuel use • Complexity of dairy rations • Lack of extant LCA for many items • Almond hulls, citrus pulp, apple pomace • Surrogate feeds adopted • Crop production practices • Tillage, soil type, etc affect N2O • Lime fate (soil acidity) • Consistency of background data • System boundaries, linking to relevant upstream information
Challenges: Allocation • System expansion • Physical causality • Economic value • Mass/Energy content • By-products: • Distiller’s grains, grain meals, pulp, etc • Milk and beef • Cream and milk products • Refrigeration at retail and in-home
Dairy Fluid MilkFarm Level Data Collection Producer Surveyfor On-Farm Data Collect representative data from U.S. dairy producers to establish a carbon footprint baseline relevant to conditions in the United States. Single farm footprint will have similar goal, but obviously require site specific data and understanding of practices
Producer Survey • 43 questions in 9 areas • About Your Facility • On-Facility Crop Production • Manure Management • Energy Usage • Housing & Milking Information • Animal Feedstuffs & Grazing Practices • 500+ usable surveys returned
Producer Survey Data • Tremendous effort from farmers • Generally very conscientious in providing information • Despite multiple revisions, still some confusion • Missing information • Herd demographics often incomplete • Manure management quantities inconsistent • On-farm crop production data • Animal diets – information runs the gamut! • Lesson: • Farm scale analysis will need knowledgeable data collectors and very patient farmers
Data Management & Reconciliation • Each survey entered twice; copies compared and corrected by reference to original • Outliers identified • (eg 13 day calving interval months) • Milk production • Missing data interpolated by substitution with weighted regional average • Herd demographics • Dry matter intake (regional average ration used when missing) • MUN, fat and protein
On-Farm Emissions Enteric, manure, energy Data from producer survey & existing models
Diet and Enteric Methane • Diet from survey matched with NRC feed database to determine relevant parameters: • Crude Protein, DE, NEg, NEL, … • Milk to Beef allocation calculations • Model Comparisons: • Ellis DMI model has lowest RMSE • Biogenic GHGs • Methane explicitly accounted • Other biogenic carbon cycling is not explicitly accounted • In line with current IDF discussions
Milk / Beef Allocation Choices • System expansion • Beef from dairy not quite equivalent to ‘Angus’ • Culled cows similar to breeder stock; bull calves have no real equivalent • LCA on US beef has not been completed • Biological / Causal • Each feed has different conversion efficiency • Determine digestible energy consumed for: • Growth • Milk production • Determine total feed energy for milk and beef, use this to define allocation fraction – Then all emissions allocated with this ratio • Economic Value
Farm Gate through Consumption Highlights
Transportation of Raw Milk from Farms to Processing Plants • ~150,000 round trips (6000 gallon trucks) in 2007 • Combined data from several dairy cooperatives. • – 11% of fluid milk delivered in 2007 • Contained in this data for each trip: • Day of the year that the trip started, from 1 to 365, in 2007 • Latitude and longitude of the plant • Latitude and longitude of each farm • Pounds of milk picked up at each farm
Cumulative Histogram of Trip Lengths average = 490 miles • Raw milk is transported from farms to plants in unrefrigerated tank trucks. • Average round trip was 490 miles, delivering 5800 gallons of milk. • Heavy truck emissions were 2.13 kg CO2e/mile. • Resulting emissions were 0.19 kg CO2e/gallon milk delivered.
Milk Processing & Distribution Processing (pasteurization), packaging, and distribution to retail
Processor Survey Details • Total of 50 processing plants provided data for 2007 • ~ 25% of all fluid milk processed in 2007 • Data verification and analysis • Two clarification rounds • Detailed blow moldingequipment specifications
Processing Contribution to GWP Gate-to-gate: 0.203 kg/kg
Retail/Consumer Passenger Car
LCA Software Tools • Excel & VBA • MatLab • SimaPro 7.1 (Pre Consultants) • Databases of LCI data • Eco Invent • US LCI • Franklin Associates • EIOLCA http://www.eiolca.net • Open IO – Carbon http://www.open-io.org • Earthster http://www.earthster.org • Open source data repository and computational engine
Supply Network ~100 of 2000+ linked unit processes that software and databases allow to be modeled, so your effort is focused on the closest processes of interest
Why an LCA of Milk Production? Consumers are interested in product sustainability. Increasing willingness to make purchase decisions based on (perceived) environmental impacts. Potential for reduction in consumption of dairy. Science-based LCA can provide: Data that will allow the industry to identify and engage more sustainable approaches Reduce environmental impacts that can be validated through LCA measurements. Other benefits: Systems understanding allows positioning dairy products in the marketplace based on sustainable attributes respond proactively to consumer concerns. Supports industry’s ability to work with retailers to educate consumers about agricultural and food sustainability issues. Establish a baseline for GHG offset projects which may result from legislation in the future
Whose carbon is it? • ISO compliant LCA should be cradle to grave in scope • Does the dairy farmer get credit for more efficient corn production? • Yes: in the context of a full LCA accounting of the entire supply chain, they can legitimately claim milk has overall lower impact. • AND • No: in the context of carbon credits or carbon trading. Here the WRI concepts of Scope 1,2,3 are useful. • Scope 1: on-site emissions (enteric methane, diesel combustion) • Scope 2: indirect emissions (mostly electricity) • Scope 3: indirect emissions further up the supply chain (N2O from fertilizer manufacture, or diesel combustion for commodity crop production) • LCA is a useful tool and framework for Scope 1 assessment, but for carbon trading full LCA is not really appropriate
Summary • Bottom line: Milk LCA results • Add up all the emissions 1 gallon of milk consumed in the US is less than equivalent to burning 1 gallon of gasoline driving 20 miles. • GHG Accounting in Agriculture • Complex systems – crops, soil, climate interactions • Data quality is likely to remain a concern – e.g., how much methane is really released at a particular farm? • Allocation can significantly affect results • Sensitivity analysis can highlight areas where good measurements are critical to proper assessment of the CF
Acknowledgements Dairy Management, Incorporated and The Innovation Center for US Dairy