Download
1 / 35
490 likes | 870 Views
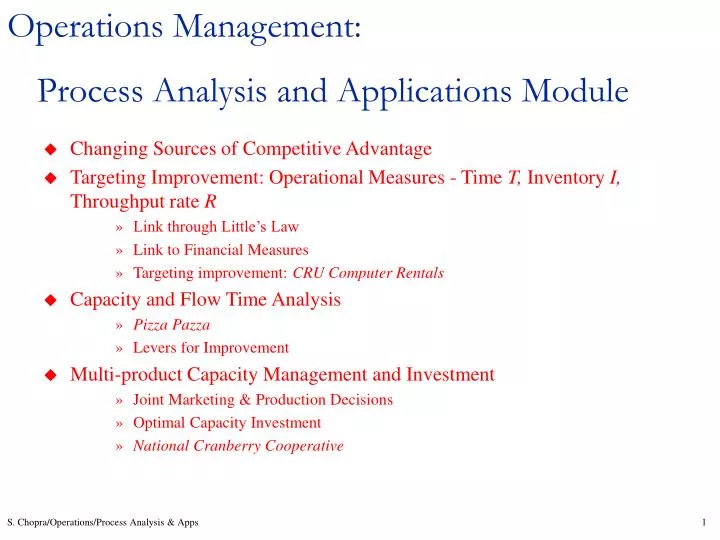
Operations Management: Process Analysis and Applications Module. Changing Sources of Competitive Advantage Targeting Improvement: Operational Measures - Time T, Inventory I, Throughput rate R Link through Little’s Law Link to Financial Measures

E N D
Operations Management: Process Analysis and Applications Module • Changing Sources of Competitive Advantage • Targeting Improvement: Operational Measures - Time T, Inventory I, Throughput rate R • Link through Little’s Law • Link to Financial Measures • Targeting improvement: CRU Computer Rentals • Capacity and Flow Time Analysis • Pizza Pazza • Levers for Improvement • Multi-product Capacity Management and Investment • Joint Marketing & Production Decisions • Optimal Capacity Investment • National Cranberry Cooperative S. Chopra/Operations/Process Analysis & Apps
Low Cost & Scale Economies (< 1960s) You can have any color you want as long as it is black Focused Factories (mid 1960s) Flexible Factories and Product variety (1970s) A car for every taste and purse. Quality (1980s) Quality is free. Time (late 1980s-1990s) We love your product but where is it? Don’t sell what you produce. produce what sells. How can operations help a company compete?The changing sources of competitive advantage S. Chopra/Operations/Process Analysis & Apps
What is Improvement? Operational Performance Measures • Flow time • Throughput • Inventory • Process Cost • Quality S. Chopra/Operations/Process Analysis & Apps
The business imperative: creating economic value x + + + + + - - x Improvement levers • Increase price • Increase throughput Price Revenues Quantity Profit Material Labor Costs • Reduce costs • Improve quality Energy Economic value added (EVA) Overhead PP&E • Reduce capital intensity • Reduce inventory Capital invested Inventory Opportunity cost Other Reduce time Weighted average cost of capital Operational metrics Financial metrics S. Chopra/Operations/Process Analysis & Apps
Relating operational measures (flow time T, throughput R & inventory I) with Little’s Law Flow rate/Throughput R [units/hr] • Flow time = Inventory / Throughput T = I / R • Turnover = Throughput / Inventory = 1/ T Inventory I [units] ... ... ... ... ... Flow Time T[hrs] S. Chopra/Operations/Process Analysis & Apps
Process Flow Examples Customer Flow: Taco Bell processes on average 1,500 customers per day (15 hours). On average there are 75 customers in the restaurant (waiting to place the order, waiting for the order to arrive, eating etc.). How long does an average customer spend at Taco Bell and what is the average customer turnover? Job Flow: The Travelers Insurance Company processes 10,000 claims per year. The average processing time is 3 weeks. Assuming 50 weeks in a year, what is the average number of claims “in process”. Material Flow: Wendy’s processes an average of 5,000 lb. of hamburgers per week. The typical inventory of raw meat is 2,500 lb. What is the average hamburger’s cycle time and Wendy’s turnover? S. Chopra/Operations/Process Analysis & Apps
Process Flow Examples Cash Flow: Motorola sells $300 million worth of cellular equipment per year. The average accounts receivable in the cellular group is $45 million. What is the average billing to collection process cycle time? Question: A general manager at Baxter states that her inventory turns three times a year. She also states that everything that Baxter buys gets processed and leaves the docks within six weeks. Are these statements consistent? S. Chopra/Operations/Process Analysis & Apps
Targeting ImprovementMBPF Inc.: Consolidated Statement S. Chopra/Operations/Process Analysis & Apps
Targeting ImprovementMBPF Inc.: Balance Sheet S. Chopra/Operations/Process Analysis & Apps
Targeting ImprovementMBPF Inc.: Inventory and Cost of Goods S. Chopra/Operations/Process Analysis & Apps
$60.2/yr $25.3/yr $110.3/yr $50.1/yr $6.5 $15.1 Raw Materials (roofs) Fabrication (roofs) $175.8/yr $175.8/yr $10.6 $9.8 $40.2/yr Assembly Finished Goods $8.6 $40.2/yr Purchased Parts (bases) Targeting Improvement MBPF Business Process Flows S. Chopra/Operations/Process Analysis & Apps
Targeting ImprovementMBPF Inc.: Flow Times S. Chopra/Operations/Process Analysis & Apps
Flow rate R ($/week) 5.0 3.38 Accounts Receivable 2.12 Assembly Finished Goods Fabrication 0.96 Raw Materials 0.77 Purchased Parts 11.12 6.75 7.12 3.14 2.90 5.80 Flow Time T (weeks) Targeting Improvement S. Chopra/Operations/Process Analysis & Apps
Why the Difference in Performance? S. Chopra/Operations/Process Analysis & Apps
CRU Computer Rentals S. Chopra/Operations/Process Analysis & Apps
Learning ObjectivesBasic Process Analysis • Process Measures: time, inventory, and throughput • What is an improvement? • Link financial and operational measures • Good operational measures are leading indicators of financial performance • Using Little’s law for process flow analysis • Targeting areas and performance measures for improvement S. Chopra/Operations/Process Analysis & Apps
Operations Management: Process Analysis and Applications Module • Changing Sources of Competitive Advantage • Operational Measures: Time T, Inventory I, Throughput rate R • Link through Little’s Law • Link to Financial Measures • Targeting Improvement: CRU Computer Rentals • Capacity and Flow Time Analysis • Pizza Pazza • Levers for Improvement • Multi-product Capacity Management and Investment • Joint Marketing & Production Decisions • Optimal Capacity Investment • National Cranberry Cooperative S. Chopra/Operations/Process Analysis & Apps
Operational Performance Measures • How to measure and decrease flow times? • How to measure and increase throughput? S. Chopra/Operations/Process Analysis & Apps
Pizza Pazza Flow Chart S. Chopra/Operations/Process Analysis & Apps
Process Architecture is defined and represented by a process flow chart: Process = network of activities performed by resources 1. Process Boundaries: • input • output 2. Flow unit: the unit of analysis 3. Network of Activities & Storage/Buffers • activities with activity times • routes: precedence relationships (solid lines) 4. Resources & Allocation 5. Information Structure & flow (dashed lines) S. Chopra/Operations/Process Analysis & Apps
Operational Measure: Flow Time Driver: Critical Activity Times • (Theoretical) Flow Time • Critical Activity • Flow Time efficiency S. Chopra/Operations/Process Analysis & Apps
Most time inefficiency comes from waiting:E.g.: Flow Times in White Collar Processes S. Chopra/Operations/Process Analysis & Apps
Levers for Reducing Flow Time • Decrease the work content of critical activities • work smarter • work faster • do it right the first time • change product mix • Move work content from critical to non-critical activities • to non-critical path or to ``outer loop’’ • Reduce waiting time. S. Chopra/Operations/Process Analysis & Apps
Operational Measure: Capacity Drivers: Resource Loads • (Theoretical) Capacity of a Resource • Bottleneck Resource • (Theoretical) Capacity of the Process • Capacity Utilization of a Resource/Process = throughput [units/hr] capacity [units/hr] S. Chopra/Operations/Process Analysis & Apps
A Recipe for Capacity Measurements * assuming system is processing at full capacity S. Chopra/Operations/Process Analysis & Apps
Pricing and Capacity Investment: Pans + Rent another oven at €10/hr? • Resource cost = €8/hour • Material cost = €1.4/pizza • Minimum sale price = • Contribution margin if sale price is €5 / pizza = S. Chopra/Operations/Process Analysis & Apps
Demand Capacity [units/time] Process Capacity Resource x NCX-10 Furnaces Marginal Investment Cost [$/unit/time] Cost Capacity Profile S. Chopra/Operations/Process Analysis & Apps
Levers for Increasing Process Capacity • Decrease the work content of bottleneck activities • work smarter • work faster • do it right the first time • change product mix • Move work content from bottlenecks to non-bottlenecks • to non-critical resource or to third party • Increase Net Availability • work longer • increase scale (invest) • increase size of load batches • eliminate availability waste: decrease changeover time S. Chopra/Operations/Process Analysis & Apps
Increasing Process Capacity in The Goal • “is to increase the capacity of only the bottlenecks” • “ensure the bottlenecks’ time is not wasted” • increase availability of bottleneck resources • eliminate non-value added work from bottlenecks • reduce/eliminate setups and changeovers • synchronize flows to & from bottleneck • reduce starvation & blockage • “ the load of the bottlenecks (give it to non-bottlenecks)” • move work from bottlenecks to non-bottlenecks • need resource flexibility • unit capacity and/or #of units. • invest S. Chopra/Operations/Process Analysis & Apps
Other factors affecting Process Capacity • Batch (Order) Sizes • Product Mix • other managerial policies ... S. Chopra/Operations/Process Analysis & Apps
Product Mix Decisions: Pizza Pazza offers 2 products Sale Price of thin crust pizza: €5.00/pizza Cost of Materials: €1.40/pizza Sale Price of deep dish pizza: €7.50/pizza Cost of Materials: €1.90/pizza S. Chopra/Operations/Process Analysis & Apps
Product Mix Decisions S. Chopra/Operations/Process Analysis & Apps
Product Mix Decisions Margin per thin crust pizza = € 3.60 Margin per deep dish pizza = € 5.60 Margin per oven minute from thin crust = 3.60×2 / 16 = € 0.450 Margin per oven minute from deep dish = 5.60×2 / 30 = € 0.373 S. Chopra/Operations/Process Analysis & Apps
National Cranberry Cooperative S. Chopra/Operations/Process Analysis & Apps
Learning Objectives: Multi-Product Process Analysis & Apps • Process measures: • Flow time manage critical activities • Capacity manage bottleneck resources • Levers for improving • Flow time manage critical activities • Decrease time in critical activities • Perform activities in parallel • Decrease waiting time • Capacity & Throughput manage bottleneck resources • Decrease unit load of bottleneck resource • Move work from bottleneck to non-bottleneck resource • Increase availability of bottleneck resource • Shifting bottleneck • Bottleneck affected by product mix, batch size and other factors • Product profitability based on $ per unit time on bottleneck S. Chopra/Operations/Process Analysis & Apps