Download
1 / 49
490 likes | 612 Views
THE TOWN WITH NO POVERTY. What happens when you give an entire town a guaranteed annual income?. I am indebted to Charles Burchill and Oke Ekuma for programming assistance, to CIHR for financial support (MOP 77533),

E N D
THE TOWN WITH NO POVERTY What happens when you give an entire town a guaranteed annual income? I am indebted to Charles Burchill and Oke Ekuma for programming assistance, to CIHR for financial support (MOP 77533), and to MB Health and Healthy Living for data access. No official endorsement by MB Health and Healthy Living is intended or implied.
We wanted to know: • What happens when a guaranteed income is offered to an entire community? • In particular: • Does population health improve?
MINCOME (1974 – 1978) • In 1974, the governments of Canada and Manitoba implemented a large field experiment to assess the impact of a Guaranteed Income • One of 5 North American GAI experiments • Part of a general reform of social safety net
MINCOME • 2 experimental sites • A dispersed sample in Winnipeg • A saturation site in Dauphin, MB • The Dauphin site was the only saturation site in any of the 5 experiments: every family was eligible to participate
MINCOME • Was designed to find out what effects a Guaranteed Annual Income would have on the labour market
Labour market results on Winnipeg sample: • Researchers who examined the Winnipeg sample found that people who received a GAI worked fewer hours BUT
Labour market results on Winnipeg sample: • Little reduction among adults working full-time jobs • Significant effects for: • Married women returned to work less quickly after childbirth • Adolescent children entered the workforce later and reduced their hours of work significantly
Health and Social Effects? • Research funding for analysis ran out midway through the experiment • Families were paid • Research concentrated on labour market • Social issues were not a primary research question • Data collected (by questionnaire) • No database constructed for social issues • No significant analysis of social issues
Health and Social Effects? • 1800 boxes of “data”: • paper copies of administrative records, • questionnaires, • reports of embedded anthropologists and sociologists who lived in the communities • Interviews with subjects on social and family interactions, labour market activity, decision-making etc. • Limitations on our ability to contact participants
Is there another way to get at the impact in Dauphin? No analysis on Dauphin sample had ever been conducted
Population Registry MCHP Information-Rich Environment: Using Administrative Data Family Services Education Hospital Home Care Physician Nursing Home Pharmaceuticals Provider Cost Vital Statistics
OUR CHALLENGE • Many things have happened since 1974 • How do we know that any changes we find are the result of MINCOME?
SOLUTION • We need to find a group of people who were similar to those who lived in Dauphin but who did not participate in the experiment • Then we can compare how they did with how the Dauphin folks did
First: • We matched on geography • We only considered people who lived in towns similar to Dauphin
Then we matched on other characteristics: • Individual: age, sex • Family: number of children, single parent female led • Community: rural/small town
We compared everyone who lived in Dauphin to 3 other similar people: • Excellent matches on all the matching variables • We also looked at the 1971 census to make sure that they were not different in other ways (religion, ethnicity, employment variables, etc.)
We found: • Significant differences in: • % farmland planted in canola • Ethnicity (Dauphin is more “Ukrainian”) – about 31% versus 10% • Does ethnicity matter?
WERE THEY HEALTHIER? • No direct measure • We examined contacts with the healthcare system
In 1973 Dauphin residents experienced: 19.23 more hospitalizations per 1,000 population +/- 2.096 (95% confidence level)
By the second half of 1978 • The differential fell to zero • Hospitalization rates for Dauphin residents fell 8.5% relative to the controls • In 1978, Canada spent $ 7.4 billion on hospitals • In 2010, Canada spent $50.4 billion
HOSPITALIZATIONS Rates Comparison group Dauphin 1978 1974
HOSPITALIZATIONS: accidents and injuries rates Dauphin Comparison group 1978 1974
HOSPITALIZATIONS:mental health diagnoses rates Dauphin Comparison group 1978 1974
Contacts with family doctors: same pattern • Significant reduction in number of visits by Dauphinites relative to controls • Mental health issues seemed to be the most significant reason for the decline
We looked at: • Birth outcomes • Birth rates • Divorce rates
Birth Outcomes • Low Birthweight, At-risk birthweight, Small for gestational age births, perinatal death • No effect found • Why? • Small numbers • Universal health insurance in Manitoba (unlike US) • Rural area (poverty does not manifest as food insecurity)
Birth rates did not increase. • Fertility fell all across North America during the 1970s, especially in rural areas • Measured in a variety of ways, fertility fell further and faster among Dauphin women than among controls
Divorce Rates • No effect found
CHILDREN MAY HAVE BEEN MOST AFFECTED • Stayed in high school longer • Had first child later • Had fewer children over a lifetime
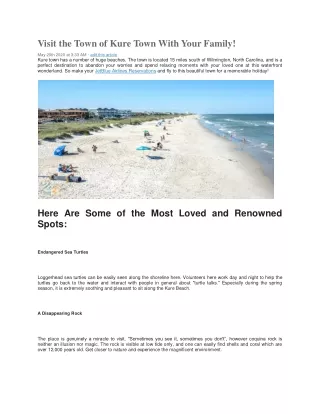
But how did the families perceive MINCOME to have affected their lives? -these results are based on interviews conducted by Lindor Reynolds for the Free Press
Amy Richardson (83) Richardson family 1970s
Amy Richardson (83): • She ran the Dauphin Beauty Parlor from her home • Her husband retired at 53 because of health problems • 6 children • Used the extra money for luxuries like school books
“It was to bring your income up to where it should be. It was enough to add some cream to the coffee. Everybody was the same so there was no shame.”
Hugh and Doreen Henderson • Lived in the country: raised chickens and grew their own food • He was a school janitor • She stayed home with the 2 children
Hugh: • “If a kid wants an education, and he’s willing to pay for it, I think the government should help. If we’d have had more money, I’d have loved to pay for university for my kids.”
Doreen: • “Give them enough money to raise their kids. People work hard, and it’s still not enough. This isn’t welfare. This is making sure kids have enough to eat.” • “They should have kept it. It made a real difference.”
Rick Zaplitny • Was a chartered accountant and his income was too high to qualify for MINCOME support • “We always felt the problem with the welfare system is it was punitive. You made money, and they took it away from you.”
“It seemed to us that MINCOME was for people who were on that line. They weren’t deadbeats. They needed a bit of a boost.” • “I’d be in favour of it [now]. Helping someone have a decent living wage is hard to argue with.”