Comprehensive Interpretative Guide to Genetic Testing Reports for Pharmacogenomics
170 likes | 286 Views
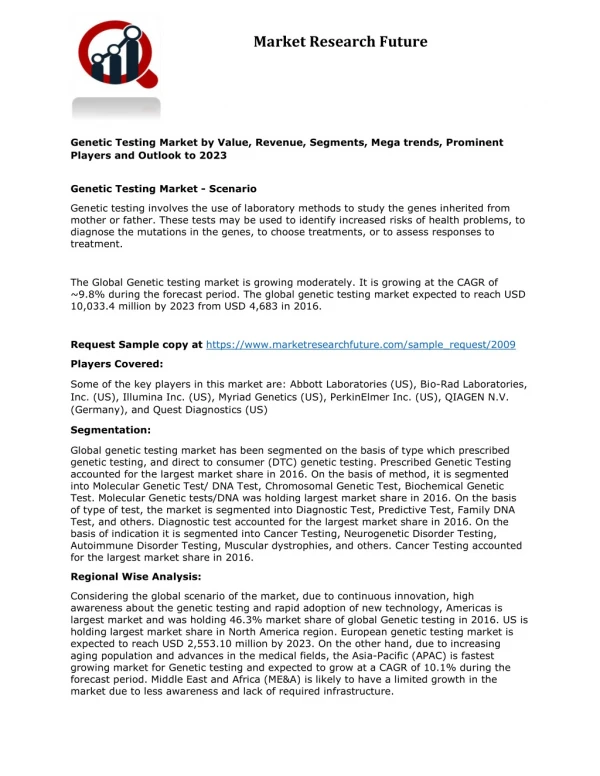
This interpretative guide provides detailed insights into multi-test genetic reports, focusing on drug sensitivity genetic testing. It explains how to read genotype and phenotype results, including normal metabolizers and those with mutations. The guide summarizes lab test interpretations for key genes such as CYP450-2C9, VKORC1, 2C19, and 2D6, detailing the significance of each result for patient treatment strategies. Raw data is presented alongside general test information, ensuring clinicians understand the clinical significance of the findings.

Comprehensive Interpretative Guide to Genetic Testing Reports for Pharmacogenomics
E N D
Presentation Transcript
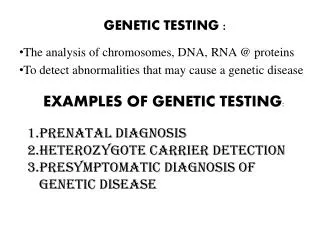
PHYSICIAN GUIDE TO GENETIC TESTING
Interpretative Guide to the Multi-Test Genetic Report (Page 1) 1. This is the ‘test result’. It shows both the genotype (‘*1/*1’) and phenotype (‘Normal Metabolizer’). For drug sensitivity genetic testing, the phenotype tells you how well the patient will metabolize drugs for the pathway being tested. Each assay in the report has a corresponding ‘test result’ indicating the patient’s genotype and phenotype for each enzyme tested. 2. These are the Raw Data. Each table under the corresponding assay shows all mutations tested in the top row and the result in the bottom row. All genes are reported as ‘Normal’ except those for which a mutation is detected. Sometimes abbreviations are used. ‘Het’ denotes a heterozygous gene mutation and ‘Mut’ denotes a homozygous mutation. All of these data are summarized in the result section (refer to 1 above). 3
Interpretative Guide to the Multi-Test Genetic Report (Page 2) 3. These are the Lab Test Interpretations. Each section gives a narrative explaining what the test result (shown on page 1 of the report) means. Each interpretation explains what constitutes both the genotype and phenotype for the test result. The interpretation also includes a brief explanation of how patient treatment may be affected by the genetic test results. 4. This is GENERAL TEST INFORMATION. It gives a brief summary of clinical significance and test methodologies. In general, this is non-essential information for clinicians but required by CLIA to be reported with the test report. 4
Interpretative Guide to CYP450-2C9 & VKORC1 Single Report 1. These are the ‘test results’. The top line shows both the genotype (‘*1/*1’) and phenotype (‘Normal Metabolizer’) for the 2C9 gene. The bottom line shows both the genotype (G/G) and phenotype (‘Low Warfarin Sensitivity’) for the VKORC1 gene. For drug sensitivity genetic testing, the phenotype tells you how well the patient will metabolize drugs for the pathway being tested. 2. These are the Lab Test Interpretations. These give a narrative explaining what the test results (shown in 1 above) mean. It explains what constitutes both the genotype and phenotype for the test result. 3. These are the Raw Data. It shows all mutations tested in the left column and the result in the right column. All genes are reported as ‘Normal’ except those for which a mutation was detected. For the VKORC1 gene a result of ‘Low Sensitivity (G/G)’ is the normal result. ‘Het’ means the gene mutation is a heterozygote and ‘Mut’ means the gene mutation is homozygous mutation. All of these data are summarized in the result section (refer to 1 above) 4. This is GENERAL TEST INFORMATION. It gives a brief summary of clinical significance and test methodologies. In general, this is non-essential information for clinicians but required by CLIA to be reported with the test report. 5
Interpretative Guide to CYP450-2C19 Single Report 1. This is the ‘test result’. It shows both the genotype (‘*1/*17’) and phenotype (‘Rapid Metabolizer’). For drug sensitivity genetic testing, the phenotype tells you how well the patient will metabolize drugs for the pathway being tested. 2. This is the Lab Test Interpretation. It gives a narrative explaining what the test result (shown in 1 above) means. It explains what constitutes both the genotype and phenotype for the test result. 3. This is the Raw Data. It shows all mutations tested in the left column and the result in the right column. All genes are reported as ‘Normal’ except those for which a mutation was detected (‘17-Het’ in this example). ‘Het’ means the gene mutation is a heterozygote and ‘Mut’ means the gene mutation is homozygous mutation. All of these data are summarized in the result section (refer to 1 above) 4. This is GENERAL TEST INFORMATION. It gives a brief summary of clinical significance and test methodologies. In general, this is non-essential information for clinicians but required by CLIA to be reported with the test report. 6
Interpretative Guide to CYP450-2D6 Single Report 1. This is the ‘test result’. It shows both the genotype (‘*1/*41’) and phenotype (‘Intermediate Metabolizer’). For drug sensitivity genetic testing, the phenotype tells you how well the patient will metabolize drugs for the pathway being tested. 2. This is the Lab Test Interpretation. It gives a narrative explaining what the test result (shown in 1 above) means. It explains what constitutes both the genotype and phenotype for the test result. 3. These are the Raw Data. It shows all mutations tested in the left column and the result in the right column. All genes are reported as ‘Normal’ except those for which a mutation was detected (‘41-Het’ in this example). ‘Het’ means the gene mutation is a heterozygote and ‘Mut’ means the gene mutation is homozygous mutation. All of these data are summarized in the result section (refer to 1 above) 4. This is GENERAL TEST INFORMATION. It gives a brief summary of clinical significance and test methodologies. In general, this is non-essential information for clinicians but required by CLIA to be reported with the test report. 7
Interpretative Guide to the CYP450-3A4&3A5 Single Report 1. These are the ‘test results’. The top line contains the 3A4 genotype (‘*1/*1B’) and phenotype (‘NormalMetabolizer’). The bottom line contains the 3A5 genotype (*1/*6) and phenotype (‘Intermediate Metabolizer’). For drug sensitivity genetic testing, the phenotype tells you how well the patient will metabolize drugs for the pathway being tested. 2. These are the Lab Test Interpretations. This section gives a narrative explaining what the test results (shown in 1 above) mean. These sections explain what constitute both the genotypes and phenotypes for the test results. 3. These are the Raw Data. The data tables show all mutations tested in the left columns and the results in the right columns. All genes are reported as ‘Normal’ except those for which a mutation was detected (‘*1B-Heterozygote’ and’*6-Heterozygote) in this example). All of these data are summarized in the result section (refer to 1 above) 4. This is GENERAL TEST INFORMATION. It gives a brief summary of clinical significance and test methodologies. In general, this is non-essential information for clinicians but required by CLIA to be reported with the test report. 8
Interpretative Guide to the Thrombosis Risk Test Single Report 1. These are the ‘test results’. The top line shows both the genotype (‘G/G’) and phenotype (‘Normal Thrombosis Risk’) for the Factor V Leiden gene. The middle line shows both the genotype (G/G) and phenotype (‘Normal Thrombosis Risk’) for the Factor II Prothrombin gene. The bottom two lines show both the genotypes (677 T/T & 1298 A/A) and phenotype (‘Significant Thrombosis and Cardiovascular Disease Risk’) for the two MTHFR genes. 2. These are the Lab Test Interpretations. Each gives a narrative explaining what the test results (shown in 1 above) mean. It explains what constitutes both the genotype and phenotype for eachtest result. 3. These are the Raw Data. The table shows all mutations tested in the left columns and the results in the right columns. All genes are reported as ‘Normal’ except those for which a mutation was detected (‘Mutant (T/T) in this example). All of these data are summarized in the result section (refer to 1 above) 4. This is GENERAL TEST INFORMATION. It gives a brief summary of clinical significance and test methodologies. In general, this is non-essential information for clinicians but required by CLIA to be reported with the test report. 9
ILLUSTRATIVE GUIDE TO CYP450 GENES: PREVALENCE AND SUBSTRATES 16