How to implement heatmap.js with PHP?
80 likes | 100 Views
Various things are available to show the heatmaps. Here in this article, we would discuss about heatmap.js and ways to implement it with the help of PHP. We offer PHP Web Development services. Read more: https://goo.gl/VW3gjc

How to implement heatmap.js with PHP?
E N D
Presentation Transcript
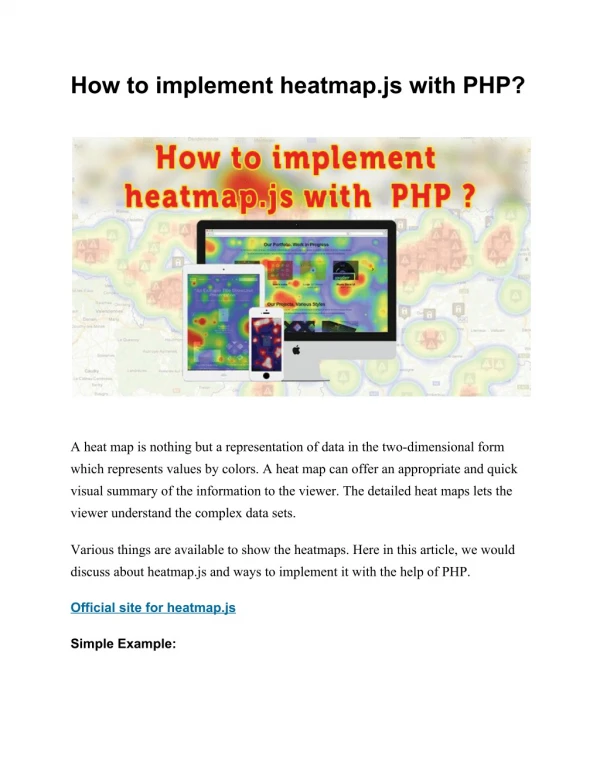
How to implement heatmap.js with PHP? A heat map is nothing but a representation of data in the two-dimensional form which represents values by colors. A heat map can offer an appropriate and quick visual summary of the information to the viewer. The detailed heat maps lets the viewer understand the complex data sets. Various things are available to show the heatmaps. Here in this article, we would discuss about heatmap.js and ways to implement it with the help of PHP. Official site for heatmap.js Simple Example:
For live Example: In this example we can show earthquake impact on different areas using color and it can be easily understood by laymen. Our Example We have to implement it on hall map to show beacon impact on users, .i.e. how many users get notified by beacon. We have added dynamic data to heatmap to show how many users pass from beacons. It simply creates dynamic heatmaps based on the data you feed into it.
By looking at the above picture we easily understand where users visit most. Configuration: Firstly, we have to include heatmap.js It has very simple configuration. 1 ) h337.create(configObject) Returns a heatmapInstance.
Use h337.create to create heatmap instances. A Heatmap can be customized with the configObject. The configObject parameter is required. Possible configuration properties: ● container (DOMNode) *required* ● A DOM node where the heatmap canvas should be appended (heatmap will adapt to the node’s size) ● backgroundColor (string) *optional* ● A background color string in form of hexcode, color name, or rgb(a) ● gradient (object) *optional* ● An object that represents the gradient (syntax: number string [0,1] : color string), check out the example ● radius (number) *optional* ● The radius each datapoint will have (if not specified on the datapoint itself) ● opacity (number) [0,1] *optional* default = .6 ● A global opacity for the whole heatmap. This overrides maxOpacity and minOpacity if set! ● maxOpacity (number) [0,1] *optional* ● The maximal opacity the highest value in the heatmap will have. (will be overridden if opacity set) ● minOpacity(number) [0,1] *optional* ● The minimum opacity the lowest value in the heatmap will have (will be overridden if opacity set) ● onExtremaChange function callback ● Pass a callback to receive extrema change updates. Useful for DOM legends. ● blur (number) [0,1] *optional* default = 0.85
● The blur factor that will be applied to all datapoints. The higher the blur factor is, the smoother the gradients will be ● xField (string) *optional* default = “x” ● The property name of your x coordinate in a datapoint ● yField (string) *optional* default = “y” ● The property name of your y coordinate in a datapoint ● valueField (string) *optional* default = “value” ● The property name of your y coordinate in a datapoint Simple configuration with standard gradient 2 ) heatmapInstance It return by h337.create We have to add our data and all other customization in this. heatmapInstance.addData(object|array) It add data points to heatmap instance. It may be object or array.
3) heatmapInstance.setData(object) Initializes a heatmap instance with a dataset. “min”, “max”, and “data” properties are required. setData removes all previously existing points from the heatmap instance and re-initializes the datastore.
Visit Our Social Profile Contact Us Company Name: Elsner Technologies Pvt Ltd Address: 305,306 Iscon Center, Shivranjani Cross Road, Satellite, Ahmedabad, India. Email Address: sales@elsner.com Website: https://www.elsner.com/