Download
1 / 54
540 likes | 562 Views
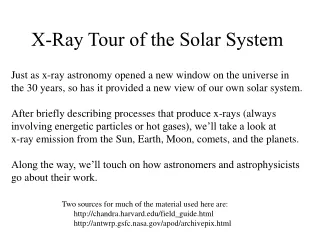
X-Ray Tour of the Solar System. Just as x-ray astronomy opened a new window on the universe in the 30 years, so has it provided a new view of our own solar system. After briefly describing processes that produce x-rays (always

E N D
X-Ray Tour of the Solar System Just as x-ray astronomy opened a new window on the universe in the 30 years, so has it provided a new view of our own solar system. After briefly describing processes that produce x-rays (always involving energetic particles or hot gases), we’ll take a look at x-ray emission from the Sun, Earth, Moon, comets, and the planets. Along the way, we’ll touch on how astronomers and astrophysicists go about their work. Two sources for much of the material used here are: http://chandra.harvard.edu/field_guide.html http://antwrp.gsfc.nasa.gov/apod/archivepix.html
Electromagnetic radiation is produced whenever a charged particle is accelerated --- changes its speed or direction, which happens whenever they collide or interact with a force such as an electromagnetic field. X-rays are usually produced by processes involving energetic particles, especially electrons and ionized atoms (or ions) interacting with other particles or photons. Here an energetic electron comes close to a proton and is accelerated by the proton’s electric field, leading to the emission of x-rays. This process produces a broad continuum of electron energies depending on how close the interaction is.
In a magnetic field a charged particle will spiral along the direction of the field, leading to the emission of x-rays if the field is strong enough and the electron energetic enough. If the electron is non-relativistic (v<<c), this is called cyclotron emission and the photon energies are discrete separated by an amount related to the magnetic field strength. This process causes a series of lines. If the electron is relativistic (v~c), this is called synchrotron emission and the photon energies form a broad continuum and the photons are beamed in the forward direction.
There are also processes that remove photons. Her an x-ray is absorbed by an oxygen atom, ejecting an electron. This process is called photo-electric absorption.
Earth’s atmosphere protects us from dangerous ultraviolet and x-ray radiation. It does this by absorbing photons at those wavelengths. This fact requires that ultraviolet, x-ray and gamma-ray astronomy be done in space.
Photons may just scatter off an electron, atom or ion. Depending on the energies of the photon and particle, the energy of the photon may be increased or decreased.
If an energetic electron collides with an atom, one of the inner shell electrons belonging to the atom may be knocked into a higher energy level. When this electron falls back to a lower level, a photon is emitted. The energy of this photon equals the difference in energies of the excited energy level and the lower energy level. This process is called collisional excitation.
Something similar may occur when an x-ray photon is absorbed. This is called fluorescent emission. The energy of the emitted photon is always less than the energy of the incident photon. This process produces line emission with the energy of the emitted lines characteristic of the atom.
If an atom or molecule encounters an ionized atom (ion), the ion may capture an electron form the atom or molecule into an excited energy level. When this electron falls to a lower energy level, a photon is emitted. The interaction may also leave an electron belonging to the atom or molecule in an excited level. If that happens, then a second photon is emitted when this electron falls to a lower energy level. This process produces line emission and is called charge-exchange.
Here we see the sun in visible light. Notice the pattern of sunspots.
Blocking the bright emission from the Sun’s disk, we see a hot corona stretching far above the surface of the Sun.
Viewed in x-rays, the Sun’s emission is very non-uniform and correlated with the positions of the sunspots. The Sun is too bright in x-rays and optical to be viewed with Chandra.
The Sun at 171 Angstroms --- very soft x-rays or extreme ultra-violet. Astronomers often look at an object over a broad wavelength range. Viewing an object at selected wavelengths provides information on the temperature and density of an object. Note the color with which we display x-ray images is arbitrary. Color can be used to illustrate intensity or temperature.
Multi-wavelength Observations In the early decades of the 20th century and before, astronomy meant optical astronomy --- observations in the narrow visible portion of the electromagnetic spectrum. In the decades since World War II, the development of radio, microwave and infrared astronomy from the ground and of ultra- violet, x-ray and gamma-ray astronomy from space has forced astronomers to study objects over the full electromagnetic spectrum. Observations at different wavelengths probe different properties of the sources and even probe different spatial regions, as we have seen for the Sun.
Collaborations Modern astronomy and astrophysics requires observations at a variety of wavelengths using many different technologies at widely separated ground and space based observatories. Once the data are in hand, scientists skilled in interpretation, computer simulation, and theory are vital for a correct understanding. Today’s astronomers work in teams, often large teams. Even theorists seldom work alone. Astronomy now requires collaboration and teamwork. The days of the single (mad?) scientist working with one (Igor?) or two devoted assistants in an isolated laboratory (Transylvania?) are over --- if they ever existed.
Here is an image of the Sun in x-rays at a time when the Sun was more active. Since the properties of the Sun’s corona and its x-ray emission are linked to solar activity and the sunspot cycle, x-ray images of the Sun can vary quite a lot.
The amount of x-ray emission from the Sun varies with the sunspot cycle.
A result of the heating of the Sun’s corona is a solar wind of material, energetic ions and electrons, and magnetic fields streaming out into the solar system where it interacts with comets, planets and their moons, and their magnetic fields.
The northern lights on Earth are one result of the solar wind’s interaction with our planet’s magnetic field. Energetic electrons streaming down magnetic field lines in the polar regions excite atoms in the atmosphere which then glow overhead.
Here is a view of Earth’s aurora from space. If we looked from high enough up, we would see an oval ring of emission above each pole. Earth’s aurora also emits x-rays and we are hoping for Chandra observations in the next year.
Telescope Time Telescope and observatory facilities funded by the federal government hold a competition for observing time on their facility. Potential observers must write a proposal stating what they want to use the facility to observe and what science they expect to extract from their observations. In other words they try to justify their desired used of the facility. After the proposal deadline, committees of astronomers are formed to judge the relative merits of these proposals. An effort is made to keep these committees composed of objective but competent people. A scientist doesn’t want someone without knowledge to make these judgements, but he doesn’t want his competitor to make them either … at least not on his proposal. Competition for telescope time is fierce. In the last Chandra proposal round, only about one in three proposals were awarded time.
The moon is visible to us because it reflects and scatters sunlight to us from its surface.
X-rays from the moon also come from the Sun-illuminated portion of the lunar surface, as does the visible light. The x-rays from the moon are either scattered solar or fluorescent x-rays. The fluorescent x-rays carry information about the composition of the lunar surface.
Comet Linear C/1999 S4 was one of the more interesting comets of recent years. It actually, and unexpectedly, broke apart as it passed around the Sun.
Astronomers were surprised to discover that comets are x-ray emitters. Why would a cold comet emit x-rays? The answer is the charge-exchange mechanism. Energetic ions from the Sun interact with atoms in the comet’s halo. In the collision an electron is transferred to an excited energy level of the ion. When the electron falls to a lower energy level, an x-ray is emitted.
These Hubble Space Telescope Images show the comet brightenting and just beginning to break apart. Disintegration into little pieces took place around uly 25, 2000.
As for the Moon, the visible light by which we see Venus is reflected or reprocessed sunlight.
The x-rays observed from Venus by Chandra are due to fluorescence. X-rays from the Sun are absorbed in a layer about 120 kilometers above the surface, exciting atoms there which then de-excite by emitting a lower energy x-ray characteristic of the absorbing atom. Also note the single photon counting.
As we just saw, Chandra counts individual photons. When viewing a sufficiently large or diffuse object, it is often useful to smooth the image to get a better idea of the spatial properties of the source.
Both the visible light and the x-ray emissions result from reprocessing electro- magnetic radiation from the Sun. The images look different because the fluorescent x-rays arise in a relatively thin layer which is transparent to these x-rays. Therefore at the edge, we see through a thicker layer than we do at the center of the disk. For the visible light it is as if we are looking at a surface.
For fluorescent emission we expect line emission and not continuum emission. By using Chandra’s diffraction gratings, we can see that the x-ray spectrum does consist of lines. The line marked O is at the position corresponding to the energy characteristic of oxygen. Lines due to nitrogen (N) and carbon (C) are harder to make out because they are at lower energies (longer wavelengths) where Chandra’s collecting power is less. They may also be intrinsically weaker.
Chandra has also observed Mars and discovered x-ray emission from it. While Chandra must observe Venus only when it is farthest from the Sun, for Mars the observations can take place when the two planets are as close together as scheduling constraints permit. This affects how the planet looks to the observer.
A planet moves across the Chandra field of view fast enough that its motion and the orbital motion of the Chandra observatory must be taken into account. Here is the motion of Mars as seen by the x-ray camera during the observations. This motion must be removed during data analysis.
Scheduling Observations There is usually an optimum time of year to observe a target. However, there are many constraints that have to be taken into account: Chandra must not look within 40 degrees of the Sun. Chandra has two cameras and two sets of gratings. Its best not to switch between instrument configurations too often. Any given time may be optimal for more than one target. Observations are not possible when Chandra is in Earth’s radiation belts. Sometimes observations must be coordinated with other observatories --- for example the Hubble Space Telescope. Various calibration targets must be observed to monitor the observatories performance.
Mars in Visible Light June 1, 2001 September 1, 2001
Chandra discovered x-ray emission from Mars. Just as for Venus it is due to fluorescent emission in the Martian atmosphere. The disk looks fuller for Mars because we see more of the sunlight side. To make this, the photon positions had to be corrected for the planet’s motion and the observatories motion.
Jupiter is by far the largest planet in the solar system. It has many moons, dust rings, a ring of ionized gas just outside the orbit of Io, very powerful radiation belts, and a huge region, called the magnetosphere, in which its magnetic field shields the planet and its environment from the solar wind. All this forms something like a mini solar system.
Hubble Space Telescope image of Jupiter’s ultraviolet aurora. The bright ring is to energetic electrons precipitating out of the Io plasma torus, streaming along magnetic field lines, and interacting in Jupiter’s atmosphere. Electrons also precipitate along field lines connected to the Galilean moons, leading to emission that traces the moons’ motions about Jupiter.
Image or Spatial Resolution Image or spatial resolution has to do with the fuzziness or sharpness of an image. At low resolution the image is fuzzy and fine details are lost. At higher resolution these fine details can be recovered. However, in x-ray astronomy the sources are faint. So if the collecting power is not increased the better resolution comes at the price of longer integration times in order to collect enough photons to make an image showing the fine details. Launched in 1978 the Einstein Observatory had a spatial resolution of ~ 10 arcsec. The ROSAT Observatory, which operated though most of the 1990s, had a spatial resolution ~ 5 arcsec and more collecting power than Einstein. The Chandra X-ray Observatory, launched in 1999, has a spatial resolution ~1/2 arcsec.
Chandra HRC Jupiter X-rays - December 18, 2000 Brightness (R) Different ways of representing the data often uncover important properties not apparent by just looking at an image formed from a single long exposure. This image shows an image averaged over Jupiter’s ~10 hour rotation period.
Chandra HRC Jupiter X-ray Map Brightness Map Brightness (R) Latitude (°) Exposure Map Latitude (°) Exposure (ks) Longitude (°)
Chandra HRC Jupiter X-ray Polar Maps North Pole South Pole Brightness (R)
45 minute quasi-periodic oscillations The Dec, 2000, Chandra HRC-I data from the northern hot spot within the auroral oval showed strong quasiperiodic oscillations at approximately 45 minutes. Cassini solar wind data acquired upstream at 200 Jupiter radii showed no comparable periodicity, even accounting for the 5-10 hour delay time for propagation from the S/C to the planet. However 45 minute variability was seen in the Galileo and Cassini energetic particle and plasma wave measurements at the time of the Chandra observation. Such periodicity is also seen at other times. Oscillations may arise from processes interior to the magnetosphere rather than in the solar wind. (Quasi-periodic radio bursts with a 45 minute timescale were observed for several months from high southern latitudes following the Ulysses flyby of Jupiter.
Follow-up Observations A single observation of an object can be deceiving. Many x-ray sources change their behavior on timescales longer than the exposure time for a single observation. In addition, observations often raise new questions that require investigation with data from follow-up observations, usually but not always with a different instrument configuration.