Download
1 / 42
420 likes | 555 Views
Model Spectra of Neutron Star Surface Thermal Emission. Soccer 2005.4.21. Outline. The nonmagnetic field surface thermal emission model (finished) About 1E 1207-5209 The magnetic field surface thermal emission model. The Nonmagnetic Field Surface Thermal Emission Model. Oppenheimer-Volkoff.

E N D
Model Spectra of Neutron Star Surface Thermal Emission Soccer 2005.4.21
Outline • The nonmagnetic field surface thermal emission model (finished) • About 1E 1207-5209 • The magnetic field surface thermal emission model
The Nonmagnetic Field Surface Thermal Emission Model Oppenheimer-Volkoff Structure of neutron star atmosphere Improved Feautrier Flux = const Radiation transfer equation Spectrum Flux ≠const Unsold Lucy process Temperature correction
Temperature profile after 20 times temperature correction 1.The result is different from those of others. 2.Adding correction times will let temperature profile diverge.
The Nonmagnetic Field Surface Thermal Emission Model The delT derived from Unsold-Lucy process
Frequency=1e17(Hz) limb-darkening
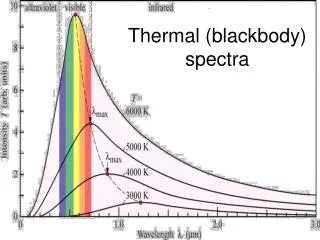
The spectra reveal limb-darkening and high energy tail and are different from Plank function significantly.
The Nonmagnetic Field Surface Thermal Emission Model Physical depth z~1cm << R~10^6cm , thus the assumption of plane-parallel is good.
About 1E 1207-5209 In August 2002 by XMM-Newton from De Luca, Mereghetti, Caraveo, Moroni, Mignani, Bignami, 2004, ApJ 418. supernova remnant G296.5+10.0 P~424ms P derivative~1.4*10-14ss-1 Red represents photons in the 0.3-0.6 keV band, green and blue correspond to the 0.6-1.5 keV and 1.5-8 keV bands respectively. 1E 1207.4-5209
Figure 5: Fit of the phase-integrated data. The model (double blackbody plus line components) is described in the text. From top to bottom, the panels show data from the pn, the MOS1 and the MOS2 cameras. In each panel the data are compared to the model folded through the instrumental response (upper plot); the lower plot shows the residuals in units of sigma.
Four absorption features have central energies colse to the ratio 1:2:3:4 From pn:0.68/0.24 : 1.36/0.18 Figure 6: Residuals in units of sigma obtained by comparing the data with the best fit thermal continuum model. The presence of four absorption features at ~0.7 keV,~1.4 keV, ~2.1 keV and ~2.8 keV in the pn spectrum is evident. The three main features are also independently detected by the MOS1 and MOS2 cameras.
About 1E 1207-5209 The feature is naturally explained by cyclotron absorption. If these lines are caused by the electron or proton cyclotron resonance, the magnetic filed are ~8*1010G or ~1.6*1014G, respectively. But from the magneto-dipole braking assumption, B is about (2.6±0.3)*1012G.
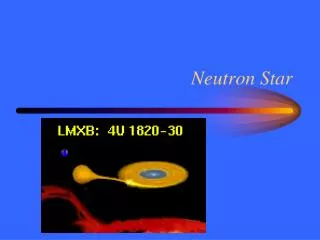
About 1E 1207-5209 Other INSs have been detected with absorption features: GEMINGA (Mignani et al. 1998, A&A, 332) SGR 1806-20 (Ibrahim et al. 2002, ApJ, 574 & 2003, ApJ, 584) AXP 1RXS J170849-400910 (Rea et al. 2003, ApJ, 586) 1RXS J130848.6+212708 (RBS 1223) (Haberl et al. 2003, A&A, 403) RX J1605.3+3249 (Kerkwijk 2003, arXiv:astro-ph/0310389) RX J0720.4-3125 (Haberl et al. 2003, arXiv:astro-ph/0312413) Others….?? Ps: For neutron stars in binary systems, direct measures of the magnetic fields were reported by Trumper et al. in 1978.
GEMINGA (From HST and other telescopes during 1987 ~ 1996) An emission feature is at ~ 6000 Å, which is explained by the proton cyclotron emission close to the surface of a a neutron star.
SGR 1806-20 (From the RXTE in 1996) ~5.0 keV, ~11.2 keV, ~17.5 keV are due to proton cyclotron resonances. (The slight deviation is because of the emission region with different magnetic B or redshift z) ~7.5 keV is due to a-patticle resonance. (The fundamental line is at ~2.4 keV.) Spectrum and best-fitcontinuum model for thesecond precursor interval, withfour absorption lines (RXTE/PCA,2~30 keV). Bottom: Pulse-heightspectrum with the modelpredicted counts (histogram). Top:Model (histogram) and theestimated photon spectrum forthe best-fit model.
AXP 1RXS J170849-400910 (From the BeppoSAX in 2001) The absorption line at ~ 8.1 keV is explained by the electron or proton cyclotron resonance. MECSand LECS spectra fromthe 0.4 - 0.58 phase intervalfitted with the "standardmodel" (the sum ofa blackbody and powerlaw with absorption) plusa cyclotron line. Residualsare relative to thestandard model alone inorder to emphasize theabsorption-like feature at ~ 8.1keV: (a) the BeppoSAXobservations merged together; (b)the 2001 observation alone;and (c) the phaseintervals contiguous to thatshowing the cyclotron absorptionfeature in the mergedobservations.
1RXS J130848.6+212708(From observation of XMM-Newton in 2003) The absorption line center at an energy of ~ 300 keV, which is explained by proton cyclotron absorption line. Figure 1: Blackbody model fits to EPIC-pn (upper pair), EPIC-MOS (middle pair) and RGS spectra of RBS1223. The four RGS spectra were combined in the plot for clarity. While the pure blackbody model fit (left) is unacceptable, including a broad Gaussian absorption line at ~ 300 eV (right) can reproduce the data. The residuals (bottom panels) show consistent behavior for all instruments.
RX J1605.3+3249 (From the XMM-Newton in 2003) The absorption is at ~0.45 keV which is explained by proton cyclotron line. Comparison of the data taken with Chandra ACIS-I and XMM EPIC through the thick filter with the best fit inferred from the EPIC data taken through the thin filter (Fig. 3). Both data sets confirm that a strong absorption feature is present near 0.4 keV.
RX J0720.4-3125 (From XMM in 2000,2002) The absorption is at ~ 271 eV which is explained by proton cyclotron line. Figure 1: Simultaneous fits using models A ( left) and B ( right) to the XMM-Newton spectra of RX J0720.4-3125. For model definition see Table 2. For each model the best fit (histogram) to the spectra (crosses) is plotted in panels a). Panels b)- d) show the residuals for EPIC-pn, -MOS and RGS spectra, respectively. For model B panel e) illustrates the best fit model with the absorption line removed. The three EPIC-pn spectra obtained with thin filter were combined for clarity in the plots, as well as all the eight RGS spectra. The MOS data below 300 eV were not used for the spectral fits. The residuals increasing with energy above 800 eV in the EPIC spectra are probably caused by pile-up (see Sect. 3.3).
About 1E 1207-5209 We assume that the absorption lines from the 1E 1207 are due to electron cyclotron resonance. Then………
The Magnetic Field Surface Thermal Emission Model Nonmagnetic magnetic field model Magnetic field model and n=1 fundamental line from Q.M. Magnetic field model and n=2,3,4 lines from Q.E.D.
The Magnetic Field Surface Thermal Emission Model The opacity which is due to Thomson scattering and free-free process in nonmagnetic field has to replace by that in the magnetic field.
The Magnetic Field Surface Thermal Emission Model Wave Propagation n a Cold Magnetized Plasma Assumptions: 1.Fully ionized hydrogen gas 2.w >> wpe,wpi w >> wci 3.The plasma is charged-neutral: ρ0=0, J0=0 4.The volume magnetic moment is negtected: M=0, μ=1 5.The cold plasma means kT 0, hence thermal electron motion is neglected compared to those induced by the wave.
The Magnetic Field Surface Thermal Emission Model From Maxwell equations and some formula derivations, we have below results. (Meszaros 1992) 1:extraordinary mode , 2:ordinary mode
The Magnetic Field Surface Thermal Emission Model z k B θ y x
The Magnetic Field Surface Thermal Emission Model As theta=0 andλ=1: Ex1/Ey1=i for X-mode, Ex2/Ey2=-i for O-mode and Ez=0. As theta=pi/2 and λ=1: Ex1/Ey1=0 for X-mode, Ex2/Ey2=i∞ for O-mode and Ez is proportional to Ey.
The Magnetic Field Surface Thermal Emission Model z B k O-mode X-mode y x
The Magnetic Field Surface Thermal Emission Model z k X-mode O-mode y B x
The Magnetic Field Surface Thermal Emission Model NEXT TIME…… Thomson scattering cross section and free-free cross section… Some results of the magnetic field model….