Download
1 / 30
300 likes | 484 Views
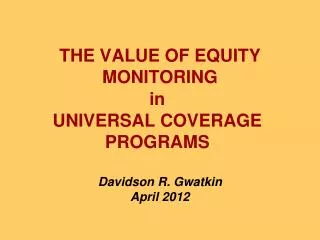
THE VALUE OF EQUITY MONITORING. in. UNIVERSAL COVERAGE PROGRAMS. Davidson R. Gwatkin April 2012. TWO QUESTIONS. Can Universal Coverage Programs Be Inequitable? Are Universal Coverage Programs Inequitable?. and a CONCLUSION. Question 1. Can Universal Coverage Programs Be Inequitable ?.

E N D
THE VALUE OF EQUITY MONITORING in UNIVERSAL COVERAGE PROGRAMS Davidson R. Gwatkin April 2012
TWO QUESTIONS • Can Universal Coverage Programs Be Inequitable? • Are Universal Coverage Programs Inequitable? and a CONCLUSION
Question 1 Can Universal Coverage Programs Be Inequitable?
“as new public health interventions and programmes initially reach those of higher socioeconomic status and only later reach the poor, there are initial increases in in equity for coverage…Inequities only improve later…” Through the Working of the “Inverse Equity Hypothesis” Source: Cesar G. Victora et al., “Explaining Trends in Inequities: Evidence from Brazilian Child Health Studies,” The Lancet, vol. 356 (2000), pp. 1093-98
If the Inverse Equity Hypothesis is Valid, the Poor Will: • Come Last in Any Quest for Universal Coverage, and • Suffer Most if Full Attainment of the Universal Coverage Goal Is Delayed or Never Achieved
From “Mass Deprivation” through “Marginal Exclusion” on the Way to Universal CoverageA Hypothetical Illustration – Part One % of Pop. Group Covered Population Group
From “Mass Deprivation” through “Marginal Exclusion” on the Way to Universal CoverageA Hypothetical Illustration – Part One % of Pop. Group Covered Population Group
From “Mass Deprivation” through “Marginal Exclusion” on the Way to Universal CoverageA Hypothetical Illustration – Part One % of Pop. Group Covered Population Group
From “Mass Deprivation” through “Marginal Exclusion” on the Way to Universal CoverageA Hypothetical Illustration – Part One % of Pop. Group Covered Population Group
From “Mass Deprivation” through “Marginal Exclusion” on the Way to Universal CoverageA Hypothetical Illustration – Part One % of Pop. Group Covered Population Group
From “Mass Deprivation” through “Marginal Exclusion” on the Way to Universal CoverageA Hypothetical Illustration – Part Two Percent of Total Gain Economic Population Group
From “Mass Deprivation” through “Marginal Exclusion” on the Way to Universal CoverageA Hypothetical Illustration – Part Two Percent of Total Gain Economic Population Group
From “Mass Deprivation” through “Marginal Exclusion” on the Way to Universal CoverageA Hypothetical Illustration – Part Two Percent of Total Gain Economic Population Group
From “Mass Deprivation” through “Marginal Exclusion” on the Way to Universal CoverageA Hypothetical Illustration – Part Two Percent of Total Gain Economic Population Group
From “Mass Deprivation” through “Marginal Exclusion” on the Way to Universal CoverageA Hypothetical Illustration – Part Two Percent of Total Gain Economic Population Group
Question II Are Universal Coverage Programs Inequitable?
How Valid is the Inverse Equity Hypothesis? • Evidence from Country Comparisons • Evidence from Time Trends
Evidence from Country Comparisons Development of an INEQUALITY PATTERN MEASURE (IPM)
The Inequality Pattern Measure (IPM)Slide I % of Pop. Group Covered Population Group
The Inequality Pattern Measure (IPM)Slide II % of Pop. Group Covered PLUS Population Group
The Inequality Pattern Measure (IPM)Slide III Minus % of Pop. Group Covered Population Group
Application of the Inequality Measure Attended Delivery Antenatal Care Medical Treatment of ARI Full Immunization Contraceptive Use (Women) Medical Treatment of Fever ORT Use
CHANGES IN COVERAGE INEQUALITIES OVER TIME (1) Source: Caryn Bredenkamp, Leander Buisman, and Adam Wagstaff, “Equity in Progress toward the MDGs: Are the Poor Being Left Behind.” Poster presented at the Second Global Symposium on Health Systems Research, Beijing, China, October-November 2012.
CHANGES IN COVERAGE INEQUALITIES OVER TIME (2) Source: Online appendix to Cesar G. Victora et al., “How Changes in Coverage Affect Equity in Maternal and Child Health Interventions in 35 Countdown to 2015 Countries: An Analysis of National Surveys,” The Lancet, vol.380 (2012). pp. 1149-57
and a CONCLUSION (I) There Is Currently No Clear Basis for Predicting Whether or How Much the Poor Will Benefit from Any Given Universal Coverage Program in Any Given Setting
and a CONCLUSION (II) This Situation Calls for: Careful Equity Monitoring of Universal Coverage Initiatives as They Progress; and A Willingness to Modify The Design of Interventions that are Found to Produce Increased Inequity
ATTENDED DELIVERIES Inequality Pattern Measure (IPM) IPM = 63.5 – 0.90 AVG R2 = 0.61 Average Population Coverage Rate (AVG)
THE FINDINGS:ORT USE Inequality Pattern Measure (IPM) IPM = 10.0 – 0.11 AVG R2 = .01 Average Population Coverage Rate (AVG)