Download
1 / 21
210 likes | 340 Views
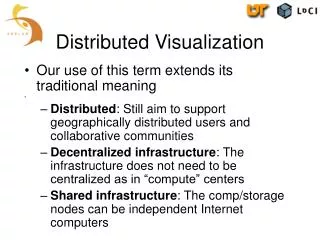
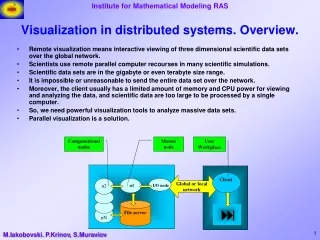
Distributed visualization of terrain models. How to get the whole world into a coffee mug... Rune Aasgaard. Where to put the workload?. Do everything at the server Requires a powerful server... …and fast network connection... ...but simple client. Render in the client

E N D
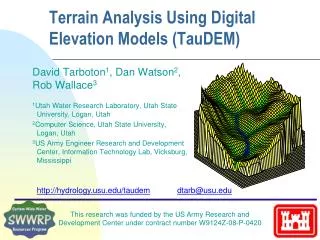
Distributed visualization of terrain models How to get the whole world into a coffee mug... Rune Aasgaard
Where to put the workload? • Do everything at the server • Requires a powerful server... • …and fast network connection... • ...but simple client. • Render in the client • Reduces load on server and network… • …smooth interactive movement actually possible… • …but requires a smart and complex client... • …and more sophisticated hardware.
Where to put the data? • Client terrain database • Near graphics system • Fast updating from server data • Limited size • Some support for simple analysis • Server terrain database • Huge data volume • Fast query access • No traversal of data • Integration of new and improved data sets?
Level-of-Detail Triangulation • Consists of: • A coarse base triangulation: T0 • A set of refinement operations: Ti • Results in: • A set of triangulations: Ti • View dependent expansion of client data structures: • Only show what is necessary for generating an image • Use screen-space error tolerance • Approximation error estimates for each refinement operation
Client data structures Should support the graphics system • Triangle strips • 3D coordinates • Surface normals • Texture coordinates • Map to a set of texture tiles • Portability - Java and Java3D
Client data structures Update with data from server • Start with coarse base triangulation • Request data from server when: • Area becomes visible • More detail is required (viewpoint moved in) • Reduce to coarser level when: • Area becomes invisible • Less detail is required (viewpoint moved out)
Server data structures Can be huge! • Whole earth, 30” grid (DTED Level 0): 933.120.000 points! • Whole earth, 3” grid (DTED Level 1): 93.312.000.000 points! • Luckily, 2/3 of the earth is ocean • Major parts of the land is relatively flat • Can benefit from data simplification and compression
Server data structures • Server responds to client requests: • in: Position • out: Elevation and Elevation approximation error • Queries are expected to be: • chunked • localized in area and resolution level
Binary Triangle Trees • Hierarchy of right-isosceles triangles • Related to Lindstrom triangulations and the ROAM algorithm
Binary Triangle Trees • Simple data structures • simplifies network streaming • Regular refinement pattern • fits well with texture tiles • simple integer coordinates • maps easily to regular quad trees • But…. • requires more triangles for representing complex objects than irregular triangulations
Approximation error spheres • One sphere for each vertex • Radius = Approximation error / angular resolution • If the viewpoint is inside sphere, display vertex