Download
1 / 31
330 likes | 579 Views
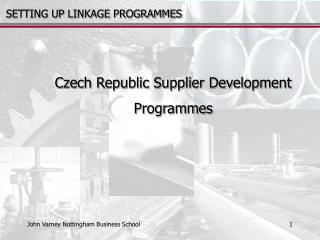
The Czech Supplier Development Programme Quality assessment and development tools. Vladimír Braun V.Braun@becon.cz 8 June, 2004. The assessment i s an integral part of the supplier development programme. The assessment was corner stone of the initial phase of the supplier programme.

E N D
The Czech Supplier Development ProgrammeQuality assessment and development tools Vladimír Braun V.Braun@becon.cz 8 June, 2004
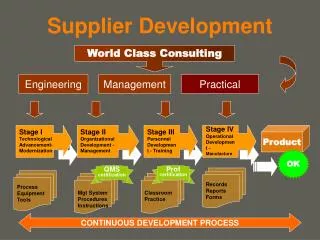
The assessment is an integral part of the supplier development programme • The assessment was corner stone of the initial phase of the supplier programme Pre selection of suppliers Initial Assessment Self improvement plans Second Assessment Selection for further assistance To select suppliers for further assistance To identify areas for improvement
The assessment tool • Requirements to the assessment tool and the methodology • Holistic view – all important aspects have to be assessed • Identification of areas for improvement – as a basis for the self improvement plans • Scoring system – for selection of suppliers for further assistance • Based on renowned and trusted methodology • Potential to be used as part of an internal business planning and continuous improvement EFQM Excellence model, used as a FRAMEWORK
European Foundation for Quality Management • Founded by 14 major European companies • BT plc KLM Royal Dutch Airlines • Robert Bosch GmbH Nestlé AG • Bull SA Philips Electronics NV • Ciba-Geigy AG Ing. C. Olivetti & C.S.p.A. • Dassault Aviation Renault • AB Electrolux Gebr. Sulzer AG • Fiat Auto Spa Volkswagen AG • As a reaction on movement in Japan and the United States
European Foundation for Quality Management Argentina: 1 1 Around 700 members in 50 countries 8 24 15 South Africa 1 19 6 2 74 11 49 124 1 7 159 3 4 1 75 66 9 8 39 4 61 1 2 4 35 7 15 2
The EFQM Excellence model Enablers Results Learning and Improvement Leadership 10% Processes 14% Key performance Results 15% People 9% People Results 9% Policy & Strategy 8% Customers Results 20% Partnerships & Resources 9% Society Results 6% The EFQM Excellence Model is a registered trademark of EFQM.
Applications of the model (assessment and self assessment) These three options were combined together Based on Facts Simulation of Award Forms Workshop High requirements on the process Low requirements Matrix Questionnaire Based on Feelings Source: EFQM.
Process of the first assessment External assessment Self assessment Discussion of results Listing of Strengths and Areas for improvement Selection of priorities according the company strategy Agreement of a basis for the action plan • Process used for the first assessment (Business Review) First Day Second Day
Specific tools used during the assessment • The Checklist (Questionnaire) • The Scoring Guide (Matrix) • The Self assessment workbook (Questionnaire)
The Checklist Imput from the Scoring quide • Structured according the nine criteria of the EFQM Excellence model • Questions were tailored to the sectors assessed • Used by trained assessors
The Scoring Guide (Matrix) - Example • 5.1.1 Clear work instructions in place • 0 = no instructions • 1 = Sporadic instructions available • 2 = Instructions issued and maintained for all products and production activities according to QM system • 3 = 2 + employed visual aids and physical samples of good and bad products • 4 = 3 + People actively involved in process of instructions correction, update and improvement
The Scoring Guide (Matrix) - Example • 5.2.8 Statistic Process Control (SPC) methods in use • 0 = no evidence of statistic methods and skills • 1 = some evidence statistics in place • 2 = Statistical evaluation of production process is standard procedure; documented; • 3 = 2 + management is fully aware and provides incentives for active use of SPC • 4 = 3 + SPC in place used for actual process control
The self assessment workbook • Inspired management of the company through the set of questions - example • The result was list of areas for improvement as seen by the management of the supplier • The self assessment served as an Ice breaker and involved management to the process of development.
The Workshop External assessment Self assessment Discussion of results Listing of Strengths and Areas for improvement Selection of priorities according the company strategy Agreement of a basis for the action plan • Findings from the external assessment and the self assessment were discussed during the workshop the next day First Day Second Day
Results of the first assessment • List of areas for improvement was agreed at the end of the assessment • Management selected 5 areas as a basis for the self improvement plans Pre selection of suppliers Initial Assessment Self improvement plans Second Assessment Selection for further assistance List of areas for improvement
The Second assessment • Purpose of the second assessment – to provide data for selection of the suppliers for further assistance • The selection criteria • Overall level of the company – measured by results of the questionnaire, based on findings from the fist and the second assessment • Ability to improve – measured by ability to complete the agreed self improvement plan
Scoring for “Overall level” was based on weights of the criteria from the EFQM excellence model People 9% People Results 9% Key performance Results Customers Results 20% Partnerships & Resources 9% Society Results 6% Learning and Improvement • Theoretical maximum of 1000 points is assigned to each criterion through its weight Enablers Results Leadership 10% Processes 14% Policy & Strategy 8% 15% The EFQM Excellence Model is a registered trademark of EFQM.
The results allow to sort and select the suppliers 500 400 300 200 100 1 2 3 4 5 6 7 8 9 10 11 12 13 14 15 16 17 18 19 20 21 22 23 24 25 26 27 28 29 30 31 32 33 34 35 36 37 38 39 40 41 42 43 44 45 46 47 48 49 50 • The Final score, which the suppliers received from the assessment
Results per criterion • The suppliers did not measure customers’ and peoples’ perception and they also struggled with business planning. 50% 40% 30% 20% 10% 0% People People Partnership Key Society Leadership Results Results Strategy Customers Results Results Policy & Pprocesses & Resources
Strengths of the suppliers • Most of the best scores were achieved in the criterion “Processes” where some of the companies have been already certified according to the latest quality standards. • Particular the most developed areas were • Quality system certification • Quality system maintenance • Lot traceability • New product introduction procedure • Assessment and evaluation of suppliers
Areas for improvement per Criterion • Leadership • The vision development and communication is usually a problem for all leaders in Small and Medium Enterprises. They do not understand why they should formulate it and share it with their people. It would probably be one of partial barriers stopping them progressing with real continuous improvement because the company staff are not involved and they do not see the overall direction behind day-to-day operations.
Areas for improvement per Criterion • Policy & Strategy • Clear and structured business planning seems to be an exclusive skill of only the most advanced companies. • Generally, SMEs are not practicing any strategic planning exercises that could provide them with a deeper understanding of their further development priorities. Even those who presented well-shaped business plans were not fully aware of the main benefits and the sense of the business planning process for the management. • As a logical consequence of this weakness many companies are not sufficiently skilled to set a proper balanced set of performance metrics. They also have no experience with linking strategic and operational metrics and targets.
Areas for improvement per Criterion • People • The deficiency in strategic planning is also projected into long-term planning of human resources with respect to the strategic development of their knowledge. • Many companies are focusing only on the operational issues in this area. It causes a gap between their long-term ambitions in high value-added sectors.
Areas for improvement per Criterion • Partnership & Resources • The general weakness of all SMEs, including those on the top of the scoring list, is cash-flow management. SMEs often do not understand the need for modelling and planning long-term cash flow. Consequently they could be at serious risk in the case of successfully gained larger contracts from MNCs. Another option emerging from this weakness is inefficient cash-management and low effectiveness of the company capital. • Long term capacity planning is an analogy to the cash flow modelling issue and strategic HR planning. A number of companies are not able to measure their current capacity utilisation and elaborate any qualified estimates for the future.
Areas for improvement per Criterion • Processes • Productivity closely bound to lead-time measurement and reduction together with work in progress optimisation and reduction. Many companies have a lack of information about lead-time and about their production progress. • Lack of capacity planning is reflected also in low focus on capacity utilisation including focus on tools and techniques like set up time reduction. This tool is not applicable elsewhere, but for instance for plastic injection moulding sector it is vital for future competitiveness.
Areas for improvement per Criterion • Results • The areas that scored “0” for more than 50% of companies are falling into “Results”, especially in the criteria of “Customers Results”, “People Results” and “Key Performance Results”. • This reflects the lack of working sensibly with the results of the data. Many companies do not observe their trends. They also do not perform benchmarking. In addition to this they do not link corrective activities with under achievement of targets that are usually not well defined. • Consequently the continuous improvement process and the PDCA (plan-do-check-act) circle are hardly observable as a standard practice at SMEs.
Some specific areas with the lowest score in each criterion from Enablers • Leadership • Leaders develop and communicate the vision, misson and values (Average = 39%) • Policy&Strategy • Strategic targets cascaded down to lower levels (27%) • People • People are involved and participating on management and continuous improvement (Average = 37%) • Planning of human resources (Average 39%) • Partnership&Resources • Cash flow management, planning and projection (35%) • Processes • Set up time reduction (where applicable) (28%) • Lead time reduction, WIP monitoring and reduction (29%) • Visual communication of results in use (35%)
Some of the areas with the lowest score were among those with the highest improvement. 1.4. Leaders develop and communicate the mission, vision and values 30 26 25 20 19 20 No. of Suppliers 11 15 10 3 3 3 5 1 0 0 0 0 1 2 3 4 Degree of evaluation Business review 1 Business review 2 • Leaders develop and communicate vision and mission • Number of companies at satisfactory level (2 and above) increased for 8 as a result of the self improvement plans
Some of the areas with the lowest score were among those with the highest improvement. • Set up time reduction • Number of companies at satisfactory level (2 and above) increased for 4 as a result of the self improvement plans
Some of the areas with the lowest score were among those with the highest improvement. • Visual communication of results in use • Number of companies at satisfactory level (2 and above) increased for 10 as a result of the self improvement plans
Summary – Key themes of the assessment • The tool based on renowned method • The content and the application should be tailored according the sector and local situation (It is beneficial to involve customers, Multinational companies, in definition of requirements) • Management of the suppliers should be involved in the process of definition and selection of the areas for improvement. • Identified areas for improvement need to be converted to the development plans. Thank You for your attention Vladimir Braun V.Braun@becon.cz