Download
1 / 27
270 likes | 393 Views
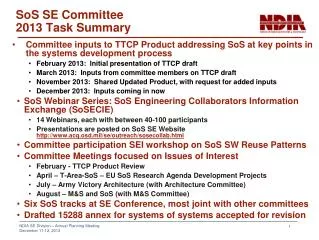
Summary of SOS Responses. Genesee Community College Fall 2006 PAD Week Presentation Assessment Luncheon August 23, 2006. SOS Administration. Administered in March 2006 65 Classes selected (random) 1144/955 students (duplicated and unduplicated) 63 Classes completed surveys

E N D
Summary of SOS Responses Genesee Community College Fall 2006 PAD Week Presentation Assessment Luncheon August 23, 2006
SOS Administration • Administered in March 2006 • 65 Classes selected (random) • 1144/955 students (duplicated and unduplicated) • 63 Classes completed surveys • 823 surveys completed • 752 valid responses scored by ACT
Demographics of Respondents • 1/3 were under age 20 • 1/3 were between 20 and 24 • 70% were female • 39% were 1st generation college • 35% took college courses in HS • 26% had a dependent child/children • 40% were receiving PELL
Demographics of Respondents • 42% work more than 20 hrs/wk in off-campus employment • 37% spend 1-5 hrs/wk on homework • 28% spend 6-10 hrs/wk on homework • 79% take mainly day classes • 17% take mainly evening classes • 3% take mainly online/DL classes
5 Sections Of The SOS • College Impressions & Plans • College Services & Facilities • College Environment, Experience, Outcomes • Personal Background Information • Genesee-Specific Questions
College Services & Facilities • On average – students were satisfied with all services and facilities • On a scale of 1(very dissatisfied) to 5 (very satisfied), average scores ranged from 3.39 to 4.11 • Students ranked 31 different services / facilities
College Services & Facilities • Students were mostsatisfied with: • Library (resources, services, facilities) • Buildings & Grounds • Internet and E-mail Services • Registration Process • Classrooms • Students were leastsatisfied with: • Parking • Food Services • Job Placement, Career Services • Athletic Facilities • Transfer Assistance
College Services & Facilities … Compared to SOS 2003 • Library, buildings & grounds ranked highest in both surveys • Greatest Improvement In: • Student Union!! • Also Financial Aid Services, and Bookstore • Greatest Decline in: • Availability of Computers When Needed • Otherwise – quite comparable
College Environment Experiences & Outcomes • Considered student satisfaction with • Academic Environment (3.47 to 4.14) • College Information (3.71 to 4.09) • Student Life (3.39 to 4.02) • Sense of Community (3.87 to 4.05) • Scale of 1( Very Dissatisfied) to 5 (Very Satisfied) • Most satisfied with Class Size, Quality of Instruction, College Website, and Faculty Respect for Students • Less satisfied with Use of Fees (technology, student activity), Student Input in College Policies/Plans
College Environment Experiences & Outcomes • Also considered impediments to success • Scale of 1(Not a Problem) to 4 (Major Problem) • Average scores ranged from 1.32 to 2.09 • Two greatest impediments posed “minor problems”: • Job-Related Responsibilities (2.09) • Financing a College Education (2.00)
College Environment Experiences & Outcomes • Also considered frequency of academic experiences • Scale of 1(Never) to 5 (Very Frequently) • Average scores ranged from 2.06 to 4.23 • Students reported most frequently • Going to class with work completed (4.23) • Working hard to meet instructor’s expectations (4.18) • Students reported leastfrequently • Unprepared faculty members (2.06) • Cheating (2.25)
College Environment Experiences & Outcomes • Also considered College Contribution to Growth& Learning • Scale of 1(No Contribution) to 5 (Very Large Contribution) • Average scores ranged from 2.82 to 3.80 (moderate range) • Students reported greatest contribution to • Acquiring Knowledge & skills for a career (3.80) • Acquiring Information, Ideas, Concepts (3.61) • Students reported leastcontribution to • Understanding rights, responsibilities as citizen (2.82) • Understanding political and social issues (2.89)
The Entire Survey Will Soon Be Available on the IR Website… FYI …CCSSE and 2003 SOS are also on the website!
(In Genesis, select the “College Info” tab. The IR link is on your right.)