Download
1 / 24
270 likes | 440 Views
Earth Science 1.3. Representing Earth’s surface. Determining location: Global grids. Long ago, people had to rely on maps made by travelers and explorers. Maps. Later, photographs taken from airplanes allowed more advanced maps to be made. Satellite Mapping.

E N D
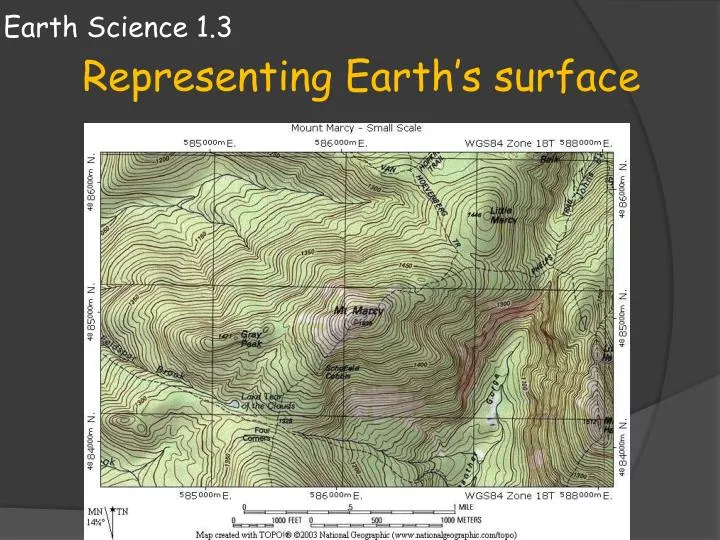
Earth Science 1.3 Representing Earth’s surface
Determining location: Global grids • Long ago, people had to rely on maps made by travelers and explorers
Maps • Later, photographs taken from airplanes allowed more advanced maps to be made
Satellite Mapping • Today, satellite mapping allows us to instantly locate any spot on Earth with detailed maps and ariel images.
Global Grid • In addition to accurate data, mapmakers needed a precise way to describe the exact location of land features. • Mapmakers use a global grid to help determine location
Global Grid • Global grid lines are made up of lines called latitude and longitude. • The distance around the Earth is measured in degrees.
Latitudeis the distance north or south from the equator measured in degrees. • Longitude is the distance East or West from the Prime Meridian.
The Prime Meridian runs from pole to pole and passes through Greenwich England.
Equator and Prime Meridian • The equator is an imaginary line running around the Earth’s middle that cuts the Earth into two hemispheres • the northern • and southern hemisphere
Equator and Prime Meridian • The Prime Meridian and 180 Degree Meridian (the International Date Line) divide the Earth into Eastern and Western hemispheres.
Globes • Globes are one way to map the Earth and show accurately the distance and relation of land masses to each other. • The problem with globes is to show enough detail to see into your area, a Globe would have to be enormous.
Maps and Projections • A map is a flat projection of the Earth’s surface. • But the Earth is round! Can all Earth’s features be accurately represented on a flat surface? • The answer is no.
Map Projections • Different types of map projection systems were invented for different purposes: • 4 main types all have strengths and weaknesses • Mercator projection map • Robinson projection map • Conic projection map • Gnomonic projection map
Mercator Projection Maps • In 1569, Gerardus Mercator developed a map to help sailors navigate around the Earth. This map system is called the Mercator Projection System. • The lines of longitude and latitude are parallel on this map making it easier to show direction accurately • The drawback to these maps is that sizes and distances become distorted
Robinson Projection Map • Robinson Projection maps show most distances, sizes and shapes accurately but have distortions, especially around the edges of the maps.
Conic Projection Map • Conic projection maps are made by wrapping a cone of paper around the globe at a particular line of latitude. • There is almost no distortion along the line of latitude that is in contact with the cone but distortion increases as one moves away from the line.
Gnomonic Projection Maps • Gnomonic projections are made by touching a piece of paper on a globe so that it touches a single point on the globe’s surface. • Various points and lines are than projected on the map. • Although distances and directions are distorted, these maps are useful to sailors as they show with great accuracy the shortest distance between two points
Topographic Maps • Topographic maps represent Earth’s three-dimensional surface in 2D.
Topographic Maps • Topographic maps use contour lines to show changes in elevation. • Every position along a contour line is the same elevation is the same elevation.
Topographic Maps • The contour intervalis the distance between the contour lines. • The closer the intervals, the steeper the change in the landscape. • Lines close together indicate a steep slope while lines farther apart indicate a gentle slope change.
Map Scale • A map represents a certain amount of area on the Earth’s surface. In order to determine distances on the map and relate them to the real world, we need to use a map scale. • A map scale is a ratio. One inch on a map may represent 10 miles on a map or a hundred miles. The map scale gives you the key to understand and determine real world distances from a map.
Geologic Maps • A geologic map is a map that shows the type and age of exposed rocks in an area. Geologic maps are developed and used by geologists.
GPS and Satellite Mapping • Today the enormous amount of satellites in orbit allow us to have a variety of detailed maps of almost every place on Earth