Download

1 / 37
370 likes | 391 Views
The Carolina Vegetation Survey (CVS) and EEP collaborate to restore North Carolina's natural communities through research, training, data management, and analysis.

E N D
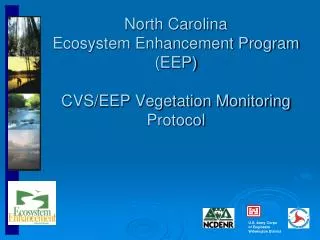
The CVS-EEP Partnership Working together to restore North Carolina's natural communities
The CVS Team • Project Directors • Robert Peet, UNC Chapel Hill • Thomas Wentworth, NC State University • Michael Schafale, NC Natural Heritage Program • Alan Weakley, NC Botanical Garden • Staff • Forbes Boyle, Project Manager • Michael Lee, Database admin & software developer
The Carolina Vegetation Survey • Multi-institutional collaborative research program. • Established in 1988 to document the composition and status of natural vegetation of the Carolinas. • Provides data, data services, and analysis to EEP and its contractors.
CVS-EEP collaboration activitiesResearch and Services • Restoration targets • Protocols and tools • Training • Data management • Data analysis
1. Restoration targets Goal: Move from crude species lists to a plot database and high-resolution community classification with quantitative descriptions. • EEP contractors can use these data to establish site-specific restoration targets. • Phase 1: National Vegetation Classification type descriptions. • Phase 2: Dynamically generated targets. • Growers can predict material needs. • EEP can anticipate significantly higher success.
Over 6000 plots, containing over 2600 species, representing over 250 vegetation types Reference data collection is an on-going activity
How to construct a template: Phase I- http://cvs.bio.unc.edu/vegetation.htm
Interactive plot map Coastal Plain brownwater river forests: levee & floodplain forests Mean site attributes for vegetation types
2. Protocols and tools CVS collaborates with EEP to: • develop and document efficient protocols for recording and monitoring vegetation, • design and create data entry and quality-control tools to optimize the efficiency and quality of data flow from field workers into the data archive.
CVS sampling protocol • 5 sampling levels provide flexibility plus consistency. • Available resources include manuals, datasets, and data entry tools. • Anticipates new federal standards • Applicable for multiple purposes and organizations
3. Training • Contractors receive hands-on training in data collection and management at annual workshops • Annual “Pulse” events provide intensive training in sampling protocols and North Carolina’s plant species and vegetation.
4. Data management • The CVS data management system insures accurate data collection and reporting. • The CVS data-entry tool allows efficient data entry with automatic error checking. • Reports and plot statistics are automatically generated. • The archived data are used in various analyses and to generate datasheets for subsequent monitoring.
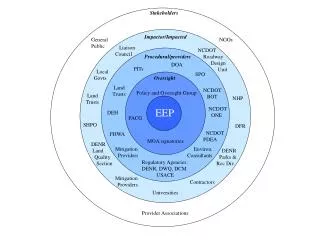
System of Databases • The Entry Tool: • Facilitates Entry of new data • From restoration sites • From reference (non-disturbed, natural) sites • Checks for potential errors • Exports a report summarizing data
System of Databases • The Migration Tool: • Used by CVS Data Administrator • Moves data from the Entry Tool into the Archive • Provides a mechanism for standardizing data across many projects • Flags possible errors
System of Databases • The Archive Database: • Stores restoration and reference data • Compliant with new national standards
System of Databases • The Viewer Tool: • View data in the Entry Tool or Archive database • Export data in configurable formats • Summarize data as standard reports, flagging areas that need attention • Map plots to confirm locations
Entry Tool Features • Contractors use the Entry Tool to digitize & organize data. • Organizes the entry process into one place • Can calculate number of required plots for a project • Efficient data entry at all CVS Levels: • Forms mimic paper datasheets • Lookup data (species, locations) quickly • Avoid redundant typing. • Flags possible errors for resolution • Reports summarize final data • New datasheets printed for future monitoring SAVES TIME & MONEY, DELIVERS HIGHER QUALITY DATA!
How many plots required? • Create a new project. • Calculate number of plots needed based on: • The project dimensions (any units) • The project area (any units) • EEP requirements Organization
Catch Errors Early • Data automatically checked for errors as entered.
Second-yearentry: twice as fast You don't have to retype data that is known from last year. The cursor stops only on the few fields with solid borders. Efficiency
Scalable: Different data levels • Data displayed to match plot sampling level • Shows what you need; hides what you don't. • Can "upgrade" plots to a higher level • Initially level 1; later level 2 to record natural vegetation, perhaps on to higher levels.
Reports generated by entry tool • Data summarized with click of a button • Multiple configuration options available • Reports based on a single year or multiple years • Reports based on a single project or multiple projects
Project Summary Highlights year of project failing to meet requirements! Summary Report Matrix of plots, species, and number of stems (This page shows 3 of 10 to 12 worksheets in the Report) Summary of Stem Vigor
5. Data analysis • CVS reports • Datasheets for monitoring • Survival & growth of planted stems • Direction of compositional change • Rate of compositional change • Problems needing attention (e.g., stem mortality, exotic species) • The data and services provided by CVS improve the likelihood that vegetation within monitored sites is developing towards a pre-defined reference condition.
Additional benefits • Restoration targets • High quality, detailed, for all vegetation types • Increases likelihood of on-time completion • Anticipates future standards • Uniquely able to handle rare species and communities • Protocols and tools greatly improve efficiency • Training improves efficiency • Data management minimizes errors and anticipates problems • Data analysis keeps EEP informed of trajectory of each project and quality of contractor services. • Financial benefits • Free: $100,000 senior staff time per year • Free: $35,000 volunteer field-worker time per year • Free: $125,000 in annual prescriptions for sites (~50*$2500)