ANCOVA
ANCOVA. What is Analysis of Covariance?. When you think of Ancova, you should think of sequential regression, because really that’s all it is Covariates enter in step 1, grouping variable(s) in step 2

ANCOVA
E N D
Presentation Transcript
What is Analysis of Covariance? • When you think of Ancova, you should think of sequential regression, because really that’s all it is • Covariates enter in step 1, grouping variable(s) in step 2 • In this sense we want to assess how much variance is accounted for in the DV after controlling for (partialing out) the effects of one or more continuous predictors (covariates) • ANCOVA always has at least 2 predictors (i.e., 1 or more categorical/ grouping predictors, and 1 or more continuous covariates). • Covariate: • Want high r with DV; low with other covariates • It is statistically controlled in an adjusted DV • If covariate correlates with categorical predictor: heterogeneity of regression (violation of assumption)
Similarities with ANCOVA • Extends ANOVA: Assess significant group differences on 1 DV • While controlling for the effect of one or more covariate • Is Multiple Regression with 1+ continuous predictor (covariates) and 1+ dummy coded predictor • So incorporates both ANOVA and Multiple Regression • Allows for greater sensitivity than with ANOVA under most conditions
When to Use ANCOVA? • Experimental Design: Best use, but often difficult to implement • Manipulation of IV (2 group double blind drug trial) • Random Selection of Subjects • Random Assignment to Groups • Multivariate Analysis: Can use ANCOVA as a follow-up to a significant MANOVA • Conduct on each DV from a significant MANOVA with remaining DVs used as Covariates in each follow-up ANCOVA • Question to ask yourself however is, why are you interested in uni output if you are doing a multivariate analysis? • Quasi-Experimental Design (controversial use) • Intact groups (students taking stats courses across state) • May not be able to identify all covariates effecting outcome
ANCOVA Background Themes • Sample Data: Random selection & assignment • Measures: Group predictor, Continuous Covariate, Continuous DV • Methods: Inferential with experimental design & assumptions • Assumptions: Normality, Linearity, Homoscedasticity, and Homogeneity of Regression: • HoR: Slopes between covariate and DV are similar across groups • Indicates no interaction between IV and covariate • If slopes differ, covariate behaves differently depending on which group (i.e., heterogeneity of regression) • When slopes are similar, Y is adjusted similarly across groups
Testing for Homogeneity of Regression • First run the Ancova model with a Treatment X Covariate interaction term included • If the interaction is significant, assumption violated • Again, the interaction means the same thing it always has. Here we are talking about changes in the covariate/DV correlation depending on the levels of the grouping factor • If not sig, rerun without interaction term
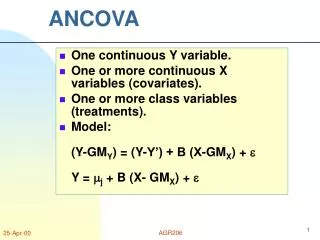
ANCOVA Model • Y = GMy + + [Bi(Ci – Mij) + …] + E • Y is a continuous DV (adjusted score) • GMy is grand mean of DV • is treatment effect • Bi is regression coefficient for ith covariate, Ci • M is the mean of ith covariate • E is error • ANCOVA is an ANOVA on Y scores in which the relationships between the covariates and the DV are partialed out of the DV. • An analysis looking for adjusted mean differences
Central Themes for ANCOVA • Variance: in DV • As usual, we are interested in accounting for the (adjusted) DV variance, here with categorical predictor(s) • Covariance: between DV & Covariate(s) • in ANCOVA we can examine the proportion of shared variance between the adjusted Y score and the covariate(s) and categorical predictor • Ratio: Between Groups/ Within Groups • Just as with ANOVA, in ANCOVA we are very interested in the ratio of between-groups variance over within-groups variance.
ANCOVA Macro-Assessment • F-test • The significance test in ANCOVA is the F-test as in ANOVA • If significant, 2 or more means statistically differ after controlling for the effect of 1+ covariates • Effect Size: ES= 2 • 2 = SSEFFECT / SSTOTAL, after adjusting for covariates • Partial 2 = SSEFFECT /(SSEFFECT + SSerror)
ANCOVA Micro-Assessment • Test of Means, Group Comparisons • Follow-up planned comparisons (e.g., FDR) • d-family effect size • While one might use adjusted means, if experimental design (i.e. no correlation b/t covariate and grouping variable) the difference should be pretty much the same as original means • However, current thinking is that the standardizer should come from the original metric, so run just the Anova and use the sqrt of the mean square error from that analysis • Graphs of (adjusted) means for each group also provide a qualitative examination of specific differences between groups.
Steps for ANCOVA • Consider the following: • All variables reliable? • Are means significantly different, i.e., high BG variance? • Do groups differ after controlling for covariate? • Are groups sufficiently homogeneous, i.e., low WG variance? • Low to no correlation between grouping variable & covariates? • Correlation between DV & covariates? • Can the design support causal inference (e.g., random assignment to manipulated IV, control confounds)?
ANCOVA Steps • Descriptive Statistics • Means, standard deviations, skewness and kurtosis • Correlations • Across time for test-retest reliability • Across variables to assess appropriateness of ANCOVA • Test of Homogeneity of Regression • ANOVA (conduct as a comparison) • ANCOVA (ANOVA, controlling for covariates) • Conduct follow-up tests between groups
Ancova Example • This example will show the nature of Ancova as regression • Ancova is essentially performing a regression and, after seeing the difference in output between the stages in a hierarchical regression, we can see what Ancova is doing
Ancova Example • Consider this simple prepost setup from our mixed design notes • We want to control for differences at pre to see if there is a posttest difference b/t treatment and control groups Pre Post treatment 20 70 treatment 10 50 treatment 60 90 treatment 20 60 treatment 10 50 control 50 20 control 10 10 control 40 30 control 20 50 control 10 10
Ancova Example • Dummy code grouping variable • Though technically it should probably already be coded as such anyway for convenience
Ancova Example • To get the compare the SS output from regression, we’ll go about it in hierarchical fashion • First enter the covariate as Block 1 of our regression, then run Block 2 with the grouping variable added
Ancova output from GLM/Univariate in SPSS Regression output 4842.105-642.623 =4199.482 Ancova Example
Ancova Example • Compared to regression output with both predictors in • Note how partial eta-squared is just the squared partial correlations from regression • The coefficient for the dummy-coded variable is the difference between marginal means in the Ancova
Ancova • So again, with Ancova we are simply controlling for (taking out, partialing) the effects due to the covariate and seeing if there are differences in our groups • The only difference between it and regular MR is the language used to describe the results (mean differences vs. coefficients etc.) and some different options for analysis