Download
1 / 32
320 likes | 412 Views
Explore the comprehensive report on air quality in Europe in 1999, covering driving forces, pollutant contributions, health and environmental impacts, sectoral emissions, and policy responses. Key indicators like PM10, ozone, NO2, and SO2 are analyzed, highlighting challenges and trends in urban and rural settings. Discover potential impacts on human health, ecosystems, and materials, along with regional concentrations and deposition levels. Gain insights into emissions trends and reduction efforts from 1990 to 1999, as well as the impact of pollutants on crops, ecosystems, and urban populations.

E N D
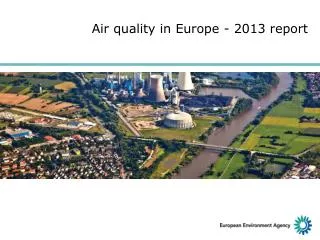
Air Quality in Europe 1999 Steinar Larssen, Kevin J. Barrett, Jaroslav Fiala, Justin Goodwin, Leif Otto Hagen, Jan F. Henriksen, Frank de Leeuw and Leonor Tarrason State-Impact-Trends-Causes-Responses EUROPEAN TOPIC CENTRE ON AIR AND CLIMATE CHANGE
Overview of Report • DPSIR SI – DP – R • Driving forces • Health-affecting AP State • Ecosystems-affecting AP Impact • Materials-affecting AP Causes (Pressure) • Responses to policies EUROPEAN TOPIC CENTRE ON AIR AND CLIMATE CHANGE
Development in Driving forces EUROPEAN TOPIC CENTRE ON AIR AND CLIMATE CHANGE
Indicators EUROPEAN TOPIC CENTRE ON AIR AND CLIMATE CHANGE
Pressures – Sectoral contributions Potential Impacts Potential Pollutant Contributing Economic Sector Drivers Emission Pressures Health Materials 0 % 0 % Ecosystems PM10 6 % 34 % 18 % 32 % 8 % 0 % 0 % 0 % Nitrogen oxides 6 % 16 % 13 % 65 % 2 % Tropospheric Ozone 8 % 12 % 53 % 4 % 20 % 3 % 1 % 1 % 0 % Sulphur dioxide 61 % 9 % 5 % 7 % 1 % 0 % Acidifying potential 26 % 13 % 25 % 31 % 4 % 1 % 1 % Eutrophying 3 % 8 % 7 % 34 % 46 % potential 0 % 20 % 40 % 60 % 80 % 100 % Energy Industry Transport Agriculture Waste Other Fugitive Emissions EUROPEAN TOPIC CENTRE ON AIR AND CLIMATE CHANGE
Selected health-effect related Indicators PM10 - 36th highest day (24h) Ozone - 26th highest day (8h) NO2 - Annual average SO2 - 4th highest day (24h) CO - Max 8 hour value EUROPEAN TOPIC CENTRE ON AIR AND CLIMATE CHANGE
Health-affecting Air Pollution - Summary EUROPEAN TOPIC CENTRE ON AIR AND CLIMATE CHANGE
PM10UrbanBackground,1999 EUROPEAN TOPIC CENTRE ON AIR AND CLIMATE CHANGE
PM10 Hot spot,1999 EUROPEAN TOPIC CENTRE ON AIR AND CLIMATE CHANGE
PM10Highestcities,1999 EUROPEAN TOPIC CENTRE ON AIR AND CLIMATE CHANGE
PM10 Trends EUROPEAN TOPIC CENTRE ON AIR AND CLIMATE CHANGE
Ozone atruralstations,1999 EUROPEAN TOPIC CENTRE ON AIR AND CLIMATE CHANGE
Ozone trends EUROPEAN TOPIC CENTRE ON AIR AND CLIMATE CHANGE
NO2in cities,1999 Urban Background Annualaverage EUROPEAN TOPIC CENTRE ON AIR AND CLIMATE CHANGE
NO2 trends, cities EUROPEAN TOPIC CENTRE ON AIR AND CLIMATE CHANGE
SO2 in cities,1999 UrbanBackground 4th highestday EUROPEAN TOPIC CENTRE ON AIR AND CLIMATE CHANGE
Impact of Urban Air Quality,1999 Population exposure estimate: Percentage of urban population in Europe living in cities where LV is exceeded in places: NO2 40-60% O3 20-30% PM10 10-15% Benzene 50% EUROPEAN TOPIC CENTRE ON AIR AND CLIMATE CHANGE
Regional NOx concentrations,1999 EUROPEAN TOPIC CENTRE ON AIR AND CLIMATE CHANGE
Total deposition of acidity,1999 H+ equivalentsper hectare p.a. Calculated by EMEP-MSCW EUROPEAN TOPIC CENTRE ON AIR AND CLIMATE CHANGE
Trend in acidity deposition Reductions sulphur and nitrogen, 1990-1999 Reduction in Sulphur deposition 1990/92-1997/99 EUROPEAN TOPIC CENTRE ON AIR AND CLIMATE CHANGE
Impacts of ozone on crops,1999 EUROPEAN TOPIC CENTRE ON AIR AND CLIMATE CHANGE
Impact of acidity, 1999 Average accumulated exceedance of the 5-percentile critical load for acidity (eq/ha/yr), 1999 EUROPEAN TOPIC CENTRE ON AIR AND CLIMATE CHANGE
Impact of eutrophication 1999 Average accumulated exceedance of the 5-percentile critical load for nutrient nitrogen (eq/ha/yr) EUROPEAN TOPIC CENTRE ON AIR AND CLIMATE CHANGE
Impact of acidity, 1999 Area of sensitive ecosystems in each country exceeding critical load for acidity,1999 EUROPEAN TOPIC CENTRE ON AIR AND CLIMATE CHANGE
Impact of eutrophication 1999 Area of each sensitive ecosystems country exceeding critical load for nutrient nitrogen, 1999 EUROPEAN TOPIC CENTRE ON AIR AND CLIMATE CHANGE
Ecosystem area potentiallydamagedby air pollution, EEA18 EUROPEAN TOPIC CENTRE ON AIR AND CLIMATE CHANGE
Trend in impact on ecosystems, 1990-1999 Area of each country exceeding critical loads Acidity EUROPEAN TOPIC CENTRE ON AIR AND CLIMATE CHANGE
Trend in impact on ecosystems, 1990-1999 Area of each country exceeding critical loads Nutrient Nitrogen EUROPEAN TOPIC CENTRE ON AIR AND CLIMATE CHANGE
Sectoral contributions to emissions,EU-1999 Potential Impacts Potential Pollutant Contributing Economic Sector Drivers Emission Pressures Health Materials 0 % 0 % Ecosystems PM10 6 % 34 % 18 % 32 % 8 % 0 % 0 % 0 % Nitrogen oxides 6 % 16 % 13 % 65 % 2 % Tropospheric Ozone 8 % 12 % 53 % 4 % 20 % 3 % 1 % 1 % 0 % Sulphur dioxide 61 % 9 % 5 % 7 % 1 % 0 % Acidifying potential 26 % 13 % 25 % 31 % 4 % 1 % 1 % Eutrophying 3 % 8 % 7 % 34 % 46 % potential 0 % 20 % 40 % 60 % 80 % 100 % Energy Industry Transport Agriculture Waste Other Fugitive Emissions EUROPEAN TOPIC CENTRE ON AIR AND CLIMATE CHANGE
Trends in EU 15 Emissions,1990-1999 EUROPEAN TOPIC CENTRE ON AIR AND CLIMATE CHANGE
Trends in emissions Example: PM10, primary + precursors EUROPEAN TOPIC CENTRE ON AIR AND CLIMATE CHANGE
Summary of AQ trends • NO2: Annual average: 12-15% red. (90-99) 19th hour: 6-13% red. (95-99) • PM10: Annual average: 4-25% red. (97-99) 35th day: 17-36% red. (95-97) • O3: Annual average: 20% incr. (95-99) 25th day: 12% red. (95-99) • SO2: Annual average: 50% red. (93-98) EUROPEAN TOPIC CENTRE ON AIR AND CLIMATE CHANGE