
Impact of Ischemia/Reperfusion on Protein Levels and Phosphorylation in Mouse Brain Models
This study investigates the effects of ischemia/reperfusion on total protein and phosphorylation statuses in the brains of wild-type and transgenic mice. Total protein levels showed no significant differences between groups, while changes in phosphorylated eIF2α and PERK were noted post-treatment. Histological analyses revealed significant neuronal damage in wild-type animals, with lesser damage observed in transgenic mice overexpressing SOD1. These findings suggest that SOD1 expression may confer neuroprotection against ischemic damage, impacting downstream signaling pathways.

Impact of Ischemia/Reperfusion on Protein Levels and Phosphorylation in Mouse Brain Models
E N D
Presentation Transcript
Total protein. Equal amounts of protein from non-ischemic brain homogenates were electrophoresed and proteins were detected by staining the gel with Sypro Ruby. There is no difference in total protein between the groups (p=0.50). Owen in preparation
Wt RIP Wt RIP nic I/R Absorbance Quantitation of immunoblot. After 20 minutes forebrain ischemia followed by 10 minutes reperfusion, there was a slight increase in eIF2a(P) in the RIP mice that did not reach statistical significance (p=0.4). There were no significant changes in total eIF2 (p=0.22) This indicates that the large elevation in eIF2a(P) levels after ischemia/reperfusion is due almost entirely to PERK.
Hayashi 2004 Fig. 1. Histological analysis of the brain 1 day after reperfusion. (A) Cresyl violet staining showed that the striatum on the ischemic side was extensively damaged in the wt animals. Massive neuronal degeneration was confirmed microscopically, and the infarcted area came very close to the ventricular wall. In the tg animals, the size of the infarct area was substantially smaller than in the wt animals. The photomicrograph showed that neurons on the medial side of the striatum were morphologically intact. Scale bar, 400 Am. (B) ATUNEL study showed that the positively labeled cells were distributed almost to the innermost area of the striatum in the wt animals, although they did not appear in that area in the tg animals. Scale bar is 400 Am for lower magnification photomicrographs and 20 Am for higher magnification photomicrographs.
Striatum Cortex Fig. 2. Change in phosphorylation status of PERK in the brain after ischemia. (A) Western blot analysis of samples from the striatum showed that the phosphorylated form of PERK was barely detectable in the sham-operated (c) wt and tg animals. In the wt animals, it was markedly increased at 1 h and further increased at 4 h, but decreased at 1 day. In the tg animals, it was increased at 1 h to a milder degree than in the wt animals, but was decreased at 4 h and 1 day. (B) Quantitative analysis of Western blot showed that tg overexpression of SOD1 significantly prevented accumulation of phospho-PERK at 4 h (**P < 0.01 compared with the wt animals at the same time point). (C) Immunohistochemistry for the phosphorylated form of PERK showed only weak immunoreactivity in the sham-operated (c) medial part of the striatum of the wt and tg animals. In the wt animals, the immunoreactivity became strong at 1 h and stronger at 4 h, but was substantially decreased at 1 day. Note that many neurons were degenerated at this time point. In the tg animals, the immunoreactivity was increased at 1 h but the degree was milder than in the wt animals. At 4 h and 1 day, the immunoreactivity gradually decreased. Higher magnification clearly confirmed that SOD1 overexpression reduced the degree of PERK phosphorylation at 4 h. (D) Western blot analysis of samples from the cortex, showed that phospho-PERK was barely detectable in the sham-operated (c) wt and tg animals. In both the wt and tg animals, it was increased at 1 h and gradually decreased thereafter. (E) Quantitative analysis showed that there was no difference in PERK phosphorylation in the cortex between the wt and tg animals. (F) In both the wt and tg animals, immunohistochemical analysis showed that phospho-PERK was barely detectable in the sham-operated (c) cortices, was dramatically increased at 1 h, and then gradually decreased. Even with higher magnification, the differences in immunoreactivity for phospho-PERK were not ascertained between the wt and tg animals at 4 h. Scale bars are 50 Am for large panels and 20 Am for insets.
Striatum Cortex Fig. 4. Change in phosphorylation status of eIF2a in the brain after ischemia. (A) Western blot analysis of samples from the striatum showed that phosphoeIF2a was barely detectable in the sham-operated (c) wt and tg animals. In the wt animals, it was markedly increased at 1 h and further increased at 4 h, but decreased at 1 day. In the tg animals, it was only mildly increased at 1 h, but gradually decreased thereafter. (B) Quantitative analysis of Western blot showed that the tg overexpression of SOD1 significantly prevented accumulation of phospho-eIF2a at 1 and 4 h (*P < 0.05, **P < 0.01 compared with the wt animals at the same time point). (C) Immunohistochemistry for phospho-eIF2a showed very weak immunoreactivity in the sham-operated (c) medial part of the striatum in the wt and tg animals. In the wt animals, the immunoreactivity became strong at 1 h and stronger at 4 h, but was substantially decreased at 1 day. Note that many neurons were degenerated at this time point. In the tg animals, the immunoreactivity was mildly increased at 1 h, and decreased thereafter. Higher magnification clearly confirmed that SOD1 overexpression reduced the degree of eIF2a phosphorylation at 4 h. (D) Western blot analysis of cortical samples showed that phospho-eIF2a was barely detectable in the sham-operated (c) wt and tg animals. In both the wt and tg animals, it was increased at 1 h and gradually decreased thereafter. (E) Quantitative analysis showed that there was no difference in eIF2a phosphorylation in the cortex between the wt and tg animals. (F) In both the wt and tg animals, immunohistochemical analysis showed that phospho-eIF2a was barely detectable in the sham-operated (c) cortices, was dramatically increased at 1 h, and then gradually decreased. Even with higher magnification, differences in immunoreactivity for phospho-PERK were no ascertained between the wt and tg cortices at 4 h. Scale bars are 50 Am for large panels and 20 Am for insets.
Striatum Cortex
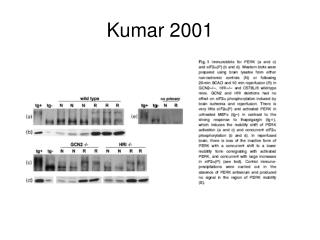
Koumenis 2002 FIG. 1. (A) Hypoxia, CoCl2, and thapsigargin (Thaps.) induce phosphorylation of eIF2 on Ser51. Cells were exposed to 0.02% O2 for the indicated times or treated with 100 M CoCl2 for 2 h or 1 M thapsigargin for 2 h. Shown at the top is an immunoblot with a rabbit polyclonal antibody raised against eIF2 phosphorylated on Ser51. The membrane was stripped and reprobed with a rabbit polyclonal antibody that recognizes both phosphorylated and unphosphorylated (total) eIF2 (bottom). The values between the two parts represent the fold induction of phosphorylated eIF2 levels compared to control levels after normalization to the total eIF2 levels, as determined by densitometric analysis of the film and use of the ScionImage densitometric analysis program (a commercial version of the NIH Image shareware program). (B) Hypoxia, CoCl2, and thapsigargin reduce the rates of protein synthesis. Cells were treated as described above and labeled with [35S]methionine (50 Ci/ml) during the last 20 min of treatment. TCA-precipitable counts were measured as described in Materials and Methods. Concentrations of O2, CoCl2, and thapsigargin were the same ones used in the experiment shown in Fig. 1A. Experiments were performed in triplicate, and averages are reported along with errors. Con, control; 35S-Meth. Inc., [35S]methionine incorporation. Hypoxia only; no glucose depletion A549 lung carcinoma cell line
FIG. 2. Kinetics and oxygen dependency of eIF2 phosphorylation in normal human fibroblasts and HeLa cells. (A) AG1522 and HeLa cells were exposed to hypoxia for the times indicated. Immunoblotting was performed with the anti-total eIF2 antibody (left) or the anti- Ser51-specific antibody (right). An anti-actin monoclonal antibody was used as a control (C or Contr.). (B) HeLa cells were exposed to different oxygen concentrations for the times indicated. The levels of phosphorylation were analyzed by densitometry and are presented as fold induction compared to that of untreated control cells (bottom graph). Cells were also treated with 1 mM dithiothreitol (DTT) as a positive control.
FIG. 3. Hypoxia-induced phosphorylation of eIF2 correlates with, but is independent of, HIF-1 accumulation. (A) A549 cells were treated with 2 or 4 h of hypoxia or with 4 h of hypoxia, followed by 30 min of reoxygenation (Reox.). Fifty micrograms of the protein extract from the 4-h hypoxia treatment was pretreated with 10 U of calf intestinal phosphatase (PPase) prior to gel electrophoresis. Membranes were immunoblotted with the anti-phospho-specific eIF2 antibody (top), anti-eIF2 antibody (middle), or a mouse monoclonal antibody raised against human HIF-1 (bottom). (B) HIF-1 +/+ and HIF-1 -/- cells were exposed to hypoxia for 1, 2, 4, and 8 h. Cell lysates were probed by Western analysis for eIF2 phosphorylation as described in the legend to Fig. 1. DTT, dithiothreitol. HIF-1a is a hypoxia-inducible protein. It has a very short half life, but rapidly accumulates under hypoxic conditions
FIG. 7. Hypoxia fails to induce phosphorylation of eIF2 in PERK -/- , but not in PKR -/- , MEFs. PERK +/+ and PERK /-- MEFs immortalized with the SV40 large-T antigen (A) and PKR +/+ and PKR -/- MEFs (B) were exposed to moderate hypoxia (0.05% O2) for the indicated times or to 1 M thapsigargin (Thaps.) for 2 h, and protein extracts were subjected to immunoblotting with a goat antibody raised against eIF2 phosphorylated on Ser51. The membrane was stripped and reprobed with a rabbit polyclonal antibody that recognizes both phosphorylated and total eIF2 . The values between the two parts represent the fold induction of phosphorylated eIF2 levels compared to control levels after normalization to total eIF2 levels. (C) Effects of hypoxia and thapsigargin on protein synthesis rates in PERK +/+ and PERK -/- MEFs. MEFs were exposed to hypoxia (0.05%) for the indicated times or treated with thapsigargin (1 M) for 2 h. During the last 20 min of the treatments, cells were labeled with [35S]methionine and TCA-precipitable counts were measured as described in Materials and Methods. The results shown are averages of three independent experiments the standard errors. Incorp., incorporation; Contr., control.
FIG. 8. Loss of PERK reduces cell survival following hypoxic stress. (A) Clonogenic survival of PERK /+ + and PERK -/- MEFs after a 24-h exposure to hypoxia (Hypox.). Following hypoxic stress, 300 cells were plated into dishes and allowed to grow under normoxia (Normox.) for 12 days. Experiments were performed in triplicate. (B) Quantitation of cell survival following hypoxic stress. Colonies representing 50 cells were counted, and cell survival fractions were calculated for control (untreated) and treated (exposed to hypoxia) cells. Average cell survival fractions (hypoxia/control [Hyp/Con]) from three independent experiments are reported for each cell line, along with the standard deviations. (C) Proliferation of PERK +/+ and PERK -/- MEFs under normoxic conditions. Five thousand cells were plated in 24-well plates, and the viable cells (cells excluding trypan blue) were counted with a hemocytometer every 24 h. WT, wild type; KO, knockout.
Munoz 2000 FIG. 1. PC12 cell morphology. A: PC12 cells differentiated with NGF (100 ng/ml) for 5 days. B and C: Differentiated control cells maintained in LSM without NGF for 4 (B) or 6 (C) h. D: Differentiated cells subjected to experimental ischemia for 4 h. E and F: Differentiated cells subjected to experimental ischemia for 4 h followed by 2 h of recovery in the absence (E) or presence (F) of NGF. Phase contrast optics. Bar 5 15 mm. This is hypoxia AND glucose depletion (OGD) Cell viability declined to 59% at 4hr of ischemia. No cell death during recovery was observed. Cell viability parameters were the same for both NGF treated and non-treated cells
TABLE 1. ATP and GTP levels and glutamate release after ischemia/recovery Glutamate (mM ) ATP (nmol/mg) GTP (nmol/mg) C 17.1 +/- 6.8 30.5 +/- 2.1 12.6 +/- 1.2 I 73.2 +/- 16.5a 10.8 +/- 1.7c 6.7 +/- 0.5b I/R30 7.9 +/- 3.6 11.4 +/- 1.0c 7.8 +/- 1.1a I/R2 ND 16.9 +/- 1.5a 6.4 +/- 0.9a ATP, GTP, and glutamate concentrations were determined as described in Materials and Methods. Data are means 6 SEM of three or four different cultures (each sample run in triplicate). C, control PC12 cells; I, 4-h ischemia; I/R30 and I/R2, 4-h ischemia followed by 30-min and 2-h reperfusion, respectively. ND, not determined. a p , 0.05, bp , 0.01, cp , 0.001, significant differences between control and ischemic cells.
FIG. 2. Protein synthesis rate after ischemia/recovery. Protein synthesis was measured in PC12 cells after ischemia and recovery, as described in Materials and Methods. Results are expressed as the percentage of control values and represent means 6 SEM of three to six different cultures. Average of [3H]methionine incorporated in controls: 49,000 cpm 3 106 cells. C, control PC12 cells; I, 4-h ischemia; I/R15, I/R30, and I/R2h, 4 h of ischemia followed by 15 and 30 min and 2 h of recovery, respectively. Statistical significance between control and ischemia/ recovery: *p , 0.05, **p , 0.01, ***p , 0.001. +NGF = -NGF All subsequent experiments done without NGF
FIG. 3. eIF2a phosphorylation status after ischemia/recovery. Cell lysates were subjected to IEF electrophoresis, and bands corresponding to eIF2a and eIF2(aP) were analyzed by protein immunoblot as described in Materials and Methods. Results are expressed as the percentage of eIF2(aP) over the total eIF2 and represent means 6 SEM of three to five different cultures. Inset: A typical experiment is shown. Lane 1, control (C); lane 2, 4-h ischemia (I); lane 3, 4-h ischemia/15-min recovery (I/R15); lane 4, 4-h ischemia/30-min recovery (I/R30). Statistical significance is as in Fig. 2.
TABLE 2. Effect of ischemia and glucose or oxygen deprivation on cell viability, protein synthesis rate, and eIF2(aP) levels Protein Cytotoxicity synthesis rate eIF2(aP) (% of dead cells) (% of control) (%) Control 0.0 100 13.3 +/- 0.95 Anoxia 10.1+/- 4.1 79.2 +/-2.2 12.0 +/- 2.5 Glucose Deprivation 22.7 +/- 7.5 88.2 +/- 4.3 19.2 +/- 0.51a Ischemia 59.8 +/- 1.8 20.5 +/- 2.2b 41.7 +/- 1.91b All three parameters were determined in differentiated PC12 cells that were maintained under glucose or oxygen deprivation or subjected to ischemia for 4 h as described in Materials and Methods. Data are means 6 SEM of two to five different cultures. a p , 0.01, bp , 0.001, significant differences between control, ischemic, or deprived (glucose or oxygen) cells.
FIG. 6. eIF2(a32P) dephosphorylation after ischemia/recovery. eIF2a phosphatase activity was determined by measuring the dephosphorylation of eIF2(a32P) (0.5 mg) by concentrated lysates as described in Materials and Methods. Bands corresponding to eIF2(a32P) were quantitated, and data represent the means 6 SEM of three or four different cultures. Data are expressed as 32P released in arbitrary units (A.U.). C, control; I, 4-h ischemia; I/R30, 4-h ischemia/30-min recovery. Inset: A typical autoradiograph is shown. Lane 1, eIF2(a32P) incubated for 30 min in the absence of extracts; lanes 2 and 3, control cells; lanes 4 and 5, ischemic cells. The arrow indicates the position of eIF2(a32P). FIG. 7. eIF2a phosphatase activity after ischemia/recovery. eIF2a phosphatase activity was determined by measuring the dephosphorylation of eIF2(aP) (3 mg) by concentrated lysates as described in Materials and Methods. eIF2(aP) bands in western blots were quantified, and the phosphate released was calculated as the difference between eIF2(aP) band in the absence of extracts (lane 1) and bands corresponding to the different extracts (lanes 2–5). Data are expressed in arbitrary units (A.U.) and represent the means 6 SEM of four to eight different cultures. Inset: A typical western blot corresponding to the analysis of the corresponding reaction mixtures (2 ml) is shown. Lane 1, eIF2(aP) incubated for 30 min in the absence of lysate, showing that the factor used as substrate is highly phosphorylated (80– 90%); lanes 2–5, eIF2(aP) incubated for 30 min in the presence of lysates from control (C; lanes 2 and 3), ischemic (I; lane 4), or 4-h ischemia/30-min recovery (I/R30; lane 5) cells; lanes 6–8, lysates incubated in the absence of added eIF2(aP) from C, I, and I/R30, respectively, to show that they do not contain detectable eIF2(aP). Statistical significance is as in Fig. 2.