COMPARISON OF POPULATION PROPORTIONS
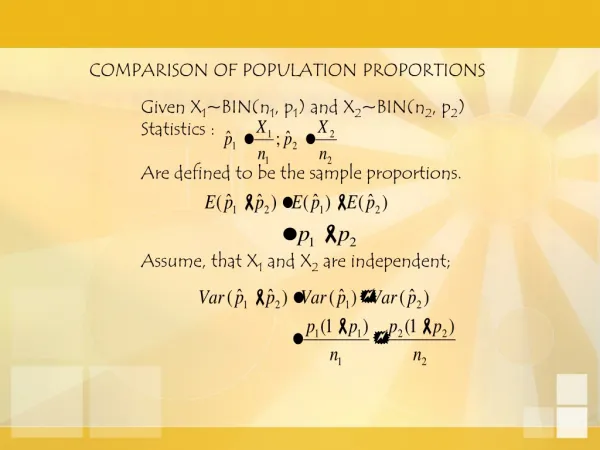
COMPARISON OF POPULATION PROPORTIONS. Given X 1 ~BIN(n 1 , p 1 ) and X 2 ~BIN(n 2 , p 2 ) Statistics : Are defined to be the sample proportions. Assume, that X 1 and X 2 are independent;. For sufficiently large n 1 and n 2 the standardized statistic : The (1- α )100% CI :

COMPARISON OF POPULATION PROPORTIONS
E N D
Presentation Transcript
COMPARISON OF POPULATION PROPORTIONS Given X1~BIN(n1, p1) and X2~BIN(n2, p2) Statistics : Are defined to be the sample proportions. Assume, that X1 and X2 are independent;
For sufficiently large n1 and n2 the standardized statistic : The (1-α)100% CI : As p1 and p2 UNKNOWN, approximate (1-α)100% CI for (p1-p2) :
In the testing situation, Ho : p1 = p2 = p ( p unknown ) Versus Test statistic : The unknown common value of p is estimated by :
EXAMPLE Members of the Department of statistics at Iowa State Union collected the following data on grades in an introductory business statistics course and an introductory engineering statistics course. Course #Students #A grades B.Stat 571 82 E.Stat 156 25 Ho : p1=p2 Vs H1 : p1≠p2 ; The proportion of A grades in two courses is equal.
The p-value is 2P(Z≤-0,52) = 0,6030 If α= 5% < p-value Ho would not be rejected Proportion of A’s does not differ significantly in the two courses.
EXERCISE An insurance company is thinking about offering discount on its life insurance policies to non smokers. As part of its analysis, it randomly select 200 men who are 50 years old and asks them if they smoke at least one pack of cigarettes per day and if they have ever suffered from heart diseases. The results indicate that 20 out of 80 smokers and 15 out of 120 non smokers suffer from heart disease. Can we conclude at the 5% los that smokers have a higher incidence of heart disease than non smokers ? Solution: DATA berumur 50th bukanperokok menderitapenyakit JANTUNG parameter : p2 berumur 50th perokok menderitapenyakit JANTUNG parameter : p1
Jelas Data Qualitative vs Test statistic : ztab Sample proportion : ; Pooled proportion estimate : Value of the test statistic:
Test statistic, is normally distributed We can calculate p-value p-value = Reject Ho
SOAL-SOAL Diberikanpmfdarivariabel random X sbb: x 0 1 2 3 p(x) 0 k k 3k2 Tentukan k sehinggamemenuhisifatdaripmf! Solusi: Adaduasifatpmf, yaitu :
Untuk Dengandemikiantidakmemenuhi. Selanjutnyauntuk dapatdiperiksaternyatapadakondisiinimemenuhisifatpmf. Jadinilai
In a public opinion survey, 60 out of a sample of 100 high-income voters and 40 out of a sample of 75 low-income voters supported a decrease in sales tax. Can we conclude at the 5% los that the proportion of voters favoring a sales tax decrease differs between high and low-income voters? What is the p-value of this test? Estimate the difference in proportions, with 99% confidence! Solution: vs Test statistic :
-1,96 0 1,96 Conclusion : don not reject Ho p-value = 2P(z > 0,93) = 2(0,1762) = 0,3524. The difference between the two-proportions is estimated to lie between -0,125 and 0,265
TEST on MEANS WHEN THE OBSERVATIONS ARE PAIRED TESTING THE PAIRED DIFFERENCES Let (X1, Y1), (X2, Y2) … (Xn, Ym) be the n pairs, where (Xi, Yi) denotes the systolic blood pressure of the ith subject before and after the drug. It is assumed that the differences D1, D2, …, Dn constitute independent normally distributed RV such that: and TEST STATISTIC: vs and
Rejection criteria for testing hypotheses on means when the observation are paired Reject Ho when or when Reject Ho when Reject Ho when
A paired difference experiment is conducted to compare the starting salaries of male and female college graduates who find jobs. Pairs are formed by choosing a male and female with the same major and similar GRADE-POINT-AVERAGE. Suppose a random sample of ten pairs is formed in this manner and starting annual salary of each person is recorded. The result are shown in table. Test to see whether there is evidence that the mean starting salary, μ1 , for males exceeds the mean starting salary, μ2, for female. Use α=0,05.
Solution: vs Test statistic : RR : reject Ho if : t > tα; t0.05,9=1,833 T-distribution with 9 dof t 0 1,833
tcal falls in RR Reject Ho at the los=0,05 Starting salary for males exceeds the starting salary for females
Consider a classroom where the students are given a test before they are taught the subject matter covered by the test. The student’s score on this pre test are recorded as the first data set. Next, the subject matter is presented to the class. After the instruction is completed, the students are retested on the same material. The scores on the second test, the post test, compose the second data set. It is reasonable to expect that a student that scored high on the pre test will also score high on the post test(and vice versa). Inherently, a strong dependency exists between the members of a pair of scores generated by each individual. Suppose that the scores in table, have been generated by 15 students under the conditions just described. How would you decide whether the instruction had been effective?
EX : Use the T statistic for the hypotheses versus , which σ = 1 to compute : a) β, if α = 0.05 and n = 16 b) α, if β = 0.025 and n = 16 c) n, if α = 0.05 and β = 0.025 Ho : μ = 5 H1 : μ = 6 Solution: vs Ho : μ = 5 μ = μo = 6 H1 : μ = 6 μ = μ1 > μo RR = { > c} Test Statistic : (a)
, berarti c = 5.438 Tidakadadalamtabel t JADI PAKAI INTERPOLASI Umumnya, dipakai INTERPOLASI LINEAR
TABEL t One tail α 0,10 0.05 0.025 0.01 0.005 0.001 υ Two-tail α 0,20 0.10 0.05 0.02 0.01 0.002 1 2 3 . . . 15 1.341 1.753 2.131 2.602 2.248
(b) β = 0.025 ; n = 16 α = ?
TABLE INTERPOLATION Suppose that it is desired to evaluate a function f(x) at a point xo , and that a table of values of f(x) is available for some, but not all, values of x. In particular, the table may not give the value f(xo) but may give values for f(x1) and f(x2) where x1< xo< x2 . We can use the known values of f(x) for x = x1 , x2 to approximate the value of f(xo) . This process is known as INTERPOLATION. Perhaps the most commonly used interpolation method is linear interpolation. If f(x) is sufficiently smooth and not too curvilinear between x = x1 and x = x2 , calculus tells us that f(x) can be regarded as being nearly linear over the interval [x1 , x2]
That is, Solving the equations : For a and b yields : Hence : f(x) a+bx f(x1) f(xo) f(x2) x1 xo x2
EXERCISE Let (X1, X2, …, Xn) be a random sample of a normal RV X with mean μ and variance 100. Let : vs As a decision test, we use the rule to accept Ho if , where is the value of sample mean. a) find RR b) find α and β for n = 16. Let (X1, X2, …, Xn) be a random sample of a Bernoulli R.V X with pmf: where it is know that 0 < p ≤ . Let : vs and n = 20. As a decision test, we use the rule to reject Ho if Ho : μ = 50 H1 : μ = 55 Ho : p = H1 : p =
Find the power function γ(p) of the test. Find α Find β : (i) if and (ii) Solutions : 2. a) b) Ho : p = vs H1 : p = X~BER(p) Table α=0.058
Let (X1, X2, …, Xn) be a random sample of a normal RV X with mean μ and variance 100. Let : vs As a decision test, we use the rule to accept Ho if . Find the value of c and sample size n such that α =0.025 and β = 0.05. Ho : μ = 50 H1 : μ = 55 Solution : n= 52 c = 52.718
Let (X1, X2, …, Xn) be a random sample of a normal RV X with mean μ and variance 36. Let : vs As a decision test, we use the rule to accept Ho if , where is the value of sample mean. a) Find the expression for the critical region/rejection region R1 b) Find α and β for n = 16. Ho : μ = 50 H1 : μ = 55 Solution : a) dimana
x1 xo x2 1.330 1.333 1.340 0.9082 ? 0.9099 1.330 1.340 x1 < xo < x2