Download
1 / 31
310 likes | 466 Views
Climate Model Simulations of Extreme C old- A ir O utbreaks (CAOs). Steve Vavrus Center for Climatic Research University of Wisconsin-Madison John Walsh International Arctic Research Center University of Alaska-Fairbanks Bill Chapman Diane Portis Department of Atmospheric Sciences

E N D
Climate Model Simulations of Extreme Cold-Air Outbreaks (CAOs) Steve Vavrus Center for Climatic Research University of Wisconsin-Madison John Walsh International Arctic Research Center University of Alaska-Fairbanks Bill Chapman Diane Portis Department of Atmospheric Sciences University of Illinois
Importance of Cold-Air Outbreaks • CAO: Incursion of extremely cold polar air mass into the middle • -lower latitudes of Eurasia and North America • CAOs cause many deaths each winter (30/year in U. S., over • 1,000 fatalities during 2003 in Bangladesh and India) • Result in billions of dollars of economic losses, especially in • agricultural sector (e.g., Florida citrus industry) • Cold surges strongly affect climatological heat balance in subtropics • and may influence onset of El Niños (via westerly wind bursts)
Cold-Air Outbreaks are complex phenomena . . . • Occurrence of CAOs is highly variable and associated with low- • frequency circulation modes (Arctic Oscillation, PNA pattern) • CAOs may be triggered by many factors, both local and remote • Climate models may help explain CAO behavior, but they have been • underutilized for this purpose • Trend of CAOs in past decades-century has not followed mean • warming trend in either U. S. or Europe
Observed Variability of Extreme Events United States Cold Waves United States Heat Waves Kunkel et al., 2002
Observed Variability of Extreme Events United States Cold Waves Walsh et al., 2001 (J. Climate) United States Heat Waves Kunkel et al., 2002
Observed Variability of Extreme Events United States Cold Waves Walsh et al., 2001 (J. Climate) United States Heat Waves Kunkel et al., 2002
Objectives • Evaluate ability of climate models to represent CAOs • (frequency, magnitude, synoptics, event types) • Use models and NCEP/NCAR Reanalysis to determine the • relative importance of thermodynamic and dynamic processes • Analyze precursor conditions and forcing factors (e.g., SSTs, • snow cover, clouds, circulation) to explain origin of CAOs • Estimate how and why CAOs may change in the future, due to • enhanced greenhouse forcing
Our Definition of a Cold Air Outbreak (CAO) Two or more consecutive days in which the daily mean temperature is at least two standard deviations below the DJF mean temperature
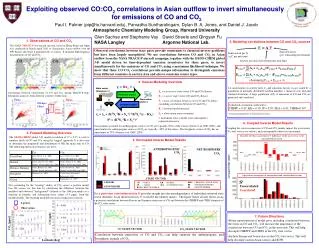
Simulated and Observed CAO Characteristics in CCM3 AMIP Runs (driven by observed SSTs from 1979-1998)
Simulated and Observed CAO Characteristics in CCM3 AMIP Runs (driven by observed SSTs from 1979-1998)
CAO WAO
Very Cold Days Actual (Expected) T < Tmean- 2s 4.2% (2.3%) CAO WAO Very Warm Days Actual (Expected) T > Tmean+ 2s 1.0% (2.3%)
Wintertime Temperature Skewness (AMIP runs, CSM1, and Observed)
CCM3 Wintertime Temperature Skewness in Pacific Northwest Modeled Skewness = -1.22 Observed Skewness = -1.19
Response of CCM3 AMIP Simulation to ENSO T42 rCAO-Nino3.4= -0.18 X T85 rCAO-Nino3.4= 0.04 OBSERVED X rCAO-Nino3.4= -0.39
Simulated Future Wintertime Circulation Changes CSM1 L L L L H
Simulated Future Wintertime Circulation Changes CSM1 CCSM3 300 hPa Height Anomalies (m) L L Sea Level Pressure Anomalies (hPa) L L H
Conclusions and Future Work • Climate models seem capable of reproducing the first-order • characteristics of cold air outbreaks • Capability of models to represent other major aspects of CAOs • is under investigation • Relative roles of various forcing terms need to be established • (e.g., SST variability, snow cover, circulation modes, etc.) • Future behavior of CAOs may be a complicated function of • mean temperature, circulation changes, and remote forcings
Our Definition of a Cold Air Outbreak (CAO) Two or more consecutive days in which the daily mean temperature is at least two standard deviations below the DJF mean temperature (“standard deviation” defined here as the average daily standard deviation of interannual air temperature variations during winter) Standard Deviation =S (sDec.1 + sDec.2 + sDec.3 + . . . + sFeb. 28)/90