Download
1 / 32
320 likes | 397 Views
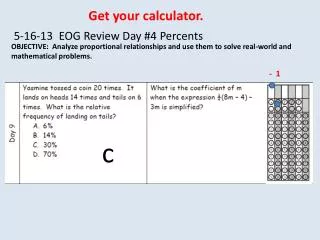
5-21-13 EOG Review Day 7 -Data and Probability. Develop understanding of statistical variability AND Summarize and describe distributions.

E N D
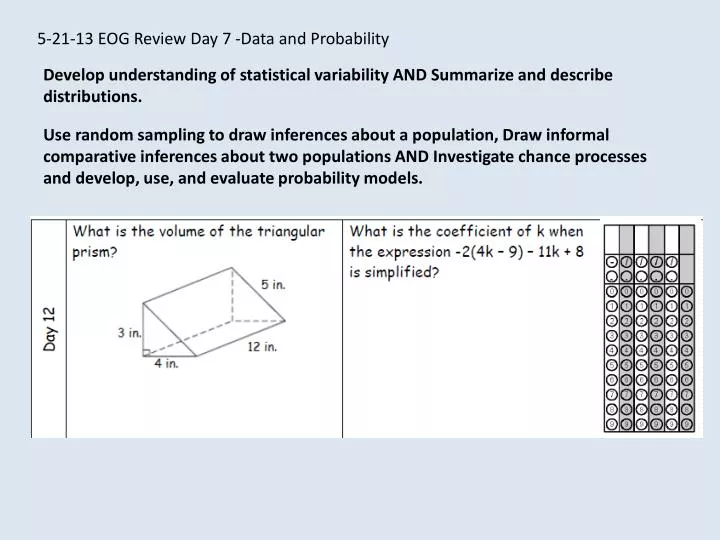
5-21-13 EOG Review Day 7 -Data and Probability Develop understanding of statistical variability AND Summarize and describe distributions. Use random sampling to draw inferences about a population, Draw informal comparative inferences about two populations AND Investigate chance processes and develop, use, and evaluate probability models.
Check homework on the number system and expressions and equations.
Once data is organized it can be described by: CENTER - Mean or Median SPREAD- Range, Interquartile Range and Mean Absolute Deviation (M.A.D) SHAPE-Mound Shape, Skew Right, Skew Left, and Uniform
30 8 5.5 5 and 9 28 The mean because the outlier is included in the calculation. The median because the outlier is crossed off first when finding the median. The mode because the outlier will never be the mode.
A bar graph can be used to display and compare data. The scale of a bar graph should include all the data values and be easily divided into equal intervals. A histogram is a bar graph that shows the frequency of data within equal intervals. There is no space between the bars in a histogram.
The graph below shows the results of a survey of 390 families. How many of the families in the survey have more than three children? A. 120 B. 130 C. 140 D. 260
Describing Data Skewed right - Extreme low values on the right Mounding or bell shaped
Skewed left - extreme low values On the left Uniform
Identify the upper and lower extremes, upper and lower quartiles, and the median of the box and whisker plot below. LQ Median UQ UE LE 71.5 The data is more spread out in that section.
CC Investigation Problem 5.1 (page 47) Part 1 - The Panthers scored the following numbers of points during games this season. Order the data from least to greatest. Give the five number summary: Minimum or lower extreme lower quartile Median Upper quartile Maximum or upper extreme Interquartile range (IQR) c. Draw a number line from 60-100. d. Make your box and draw the whiskers. e. Find the mean, median and mode for the number of points this season.
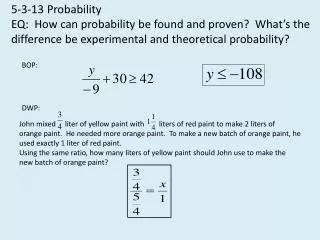
Mean Absolute Deviation • How do you find the mean absolute deviation of a set of data? • 2) Find the mean absolute deviation (MAD) of the height of the following basketball players. (Heights are in inches.): 75, 73, 76, 78, 79, 78, 79, 81, 80, 82, 81, 84, 82, 84, 80, 84 • 3) What does the MAD tell us about the heights of the basketball players? 1) Find the mean of the data. 2) Find the absolute value of the difference between each data point and the mean. 3) Find the average of those absolute values. MAD = 2.5 The average distance of each player’s height from the mean height of the players is 2.5 inches. The players are around the same height.
Experimental Probability 10-2 0 1 1 2 As likely as not Impossible Unlikely Likely Certain Course 2 All probabilities can be expressed numerically on a scale from 0 to 1.
Tree Diagrams 3 3 9
Calculate Probability What is the probability of choosing a red shirt in each of the following situations? • A drawer has only 1 red shirt. • Four red shirts and five white shirts are added to the drawer. • Three red shirts and three white shirts are added to the drawer. • Three red shirts and no white shirts are added the drawer. • No red shirts and 3 white shirts are added to the drawer. 100% or 1
Tree Diagrams Mayo Mayo 2 2 2 8
Tree Diagrams 3 3 3 27
Calculate Probability Calculate the following probabilities using the information above. 6% 2% 16%
EXIT TICKET 3-Name three things you feel confident that you know well in seventh grade mathematics. 2-Name two things you need more practice on. 1-Name one topic you enjoy. Homework: Review Handouts Wednesday - Ratio and Proportions Thursday - Geometry Friday - Data and Statistics May Calendar due on Friday, May 31.