Download
1 / 28
280 likes | 295 Views
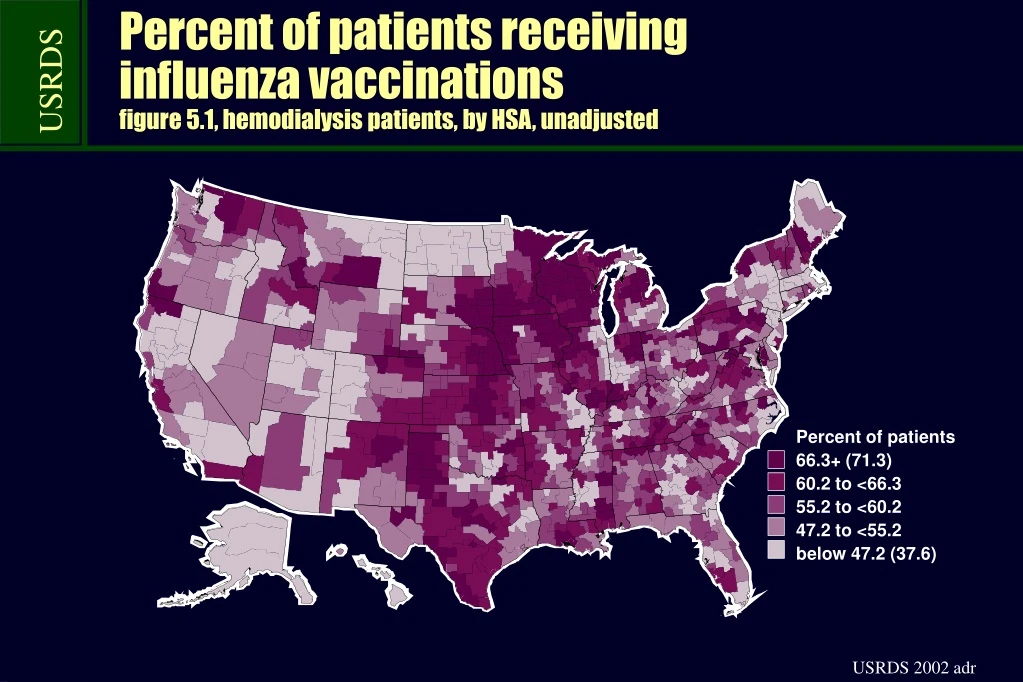
Percent of patients receiving influenza vaccinations figure 5.1, hemodialysis patients, by HSA, unadjusted. Percent of patients 66.3+ (71.3) 60.2 to <66.3 55.2 to <60.2 47.2 to <55.2 below 47.2 (37.6).

E N D
Percent of patients receivinginfluenza vaccinationsfigure 5.1, hemodialysis patients, by HSA, unadjusted Percent of patients 66.3+ (71.3) 60.2 to <66.3 55.2 to <60.2 47.2 to <55.2 below 47.2 (37.6)
Percent of patients hospitalizedfigure 5.2, hemodialysis patients, by HSA, Q4 1999 pts, admitted Q1 2000, unadjusted Percent of patients 30.2+ (31.5) 29.2 to <30.2 28.2 to <29.2 26.8 to <28.2 below 26.8 (25.4))
Percent of patients dyingfigure 5.3, hemodialysis patients, by HSA, Q4 1999 pt cohort, died in Q1 2000, unadjusted Percent of patients 6.77+ (6.98) 6.60 to <6.77 6.41 to <6.60 6.13 to <6.41 below 6.13 (5.89)
Pre- & post-ESRD patients (age 67+) care for influenza vaccinations figure 5.4, by age, & race/ethnicity, fall of pre-ESRD to fall of post-ESRD
Pre- & post-ESRD patients (age 67+) care for pneumonia vaccinations figure 5.5, by age, & race/ethnicity
Vaccination rates in the two years pre-ESRD & two years post-ESRDfigure 5.6, ESRD patients 67+, by HSA, unadjusted Percent of patients 34.9 (37.7) 31.4 to <34.9 29.0 to <31.4 26.5 to <29.0 below 26.5 (23.5)
Pre- & post-ESRD patients diabetic care: receiving diabetic eye exams figure 5.7, patients 67+, by race/ethnicity
Pre- & post-ESRD patients diabetic care: receiving lipid testing figure 5.8, patients 67+, by race/ethnicity
Pre- & post-ESRD patients diabetic care: receiving glycosylated hemoglobin testing figure 5.9, patients 67+, by race/ethnicity
Diabetic eye exams in ESRD & non-ESRD patients: ESRD patientsfigure 5.10, patients age 65–75, by HSA, unadjusted Percent of patients 60.0+ (62.8) 59.4 to <60.0 59.0 to <59.4 58.5 to <59.0 below 58.5 (57.7)
Diabetic eye exams in ESRD & non-ESRD patients: general Medicare patientsfigure 5.10, patients age 65–75, by HSA, unadjusted Percent of patients 60.0+ (64.8) 59.4 to <60.0 59.0 to <59.4 58.5 to <59.0 below 58.5 (54.8)
Diabetic eye exams in ESRD patientsfigure 5.11, patients age 18–75, by age, race/ethnicity, & modality
Lipid monitoring in diabetic patients:ESRD patientsfigure 5.12, patients age 65–75, by HSA, unadjusted Percent of patients 65.1+ (72.0) 60.4 to <65.1 56.4 to <60.4 42.9 to <56.4 below 42.9 (35.9)
Lipid monitoring in diabetic patients:general Medicare patientsfigure 5.12, patients age 65–75, by HSA, unadjusted Percent of patients 65.1+ (68.9) 60.4 to <65.1 56.4 to <60.4 42.9 to <56.4 below 42.9 (NA)
Lipid monitoring in diabetic patientsfigure 5.13, patients age 18–75, by age, race/ethnicity, & modality
Glycosylated hemoglobin (HbA1c) testing in diabetic patients: ESRD patientsfigure 5.14, patients age 65–75, by HSA, unadjusted Percent of patients 78.4+ (81.1) 75.1 to <78.4 72.2 to <75.1 61.5 to <72.2 below 61.5 (51.5)
Glycosylated hemoglobin (HbA1c) testing in diabetic patients: general Medicare patientsfigure 5.14, patients age 65–75, by HSA, unadjusted Percent of patients 78.4+ (80.5) 75.1 to <78.4 72.2 to <75.1 61.5 to <72.2 below 61.5 (60.7)
Glycosylated hemoglobin (HbA1c) monitoring in diabetic patientsfigure 5.15, patients age 18–75, by age, race/ethnicity, & modality
Frequency of Glycosylated hemoglobin (HbA1c) testing in ESRD & general Medicare patientsfigure 5.16, patients age 65–75, by the number of tests in pts surviving 1 year
Patients receiving breast cancer screeningfigure 5.17, female ESRD patients age 52–69, by HSA, unadjusted Percent of patients 42.5+ (43.9) 41.8 to <42.5 41.0 to <41.8 39.9 to <41.0 below 39.9 (38.6)
Patients receiving cervical cancer screeningfigure 5.18, female ESRD patients age 21–64, by HSA, unadjusted Percent of patients 41.2+ (43.1) 39.3 to <41.2 37.6 to <39.3 36.7 to <37.6 below 36.7 (35.5)
Patients receiving prostate cancer screeningfigure 5.19, male ESRD patients age 50+, by HSA, unadjusted Percent of patients 36.4+ (43.0) 32.7 to <36.4 29.9 to <32.7 26.6 to <29.9 below 26.6 (23.6)
Breast cancer screeningfigure 5.20, female ESRD patients age 52–69, by age, race/ethnicity, & modality
Breast cancer screening in ESRD & general Medicare patientsfigure 5.21, female patients age 52–69, by age, race/ethnicity, & patient pop.
Cervical cancer screeningfigure 5.22, female ESRD patients age 21–64, by age, race/ethnicity, & modality
Cervical cancer screening in ESRD & general Medicare patientsfigure 5.23, female patients age 52–69, by age, race/ethnicity, & patient pop.
Prostate cancer screeningfigure 5.24, male ESRD patients age 50+, by age, race/ethnicity, & modality
Prostate cancer screening in ESRD & general Medicare patientsfigure 5.25, male patients age 50+, by age, race/ethnicity, & patient pop.