Download
1 / 24
240 likes | 399 Views
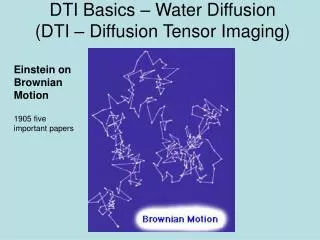
New Progresses of DTI-Map, a Program for DTI Computation and Fiber Tracking. Hangyi Jiang, Peter van Zijl, Susumu Mori. Dept. of Radiology Johns Hopkins University School of Medicine. F.M. Kirby Research Center for Functional Brain Imaging. All-in-One Strategy.

E N D
New Progresses of DTI-Map, a Program for DTI Computation and Fiber Tracking Hangyi Jiang, Peter van Zijl, Susumu Mori Dept. of Radiology Johns Hopkins University School of Medicine F.M. Kirby Research Center for Functional Brain Imaging
All-in-One Strategy • Integrating DTI computation, fiber tracking, 3D visualization, ROI drawing and statistic analysis all together; • Windows-style programming with user-friendly interface, most operations could be done just by few clicks;
Facility in Variety of Scanners Philips Siemens GE Raw data etc.
Imaging Parameter Dialog • Smart dialogs for parameters input and verification • More options for better visualization or computation efficiency • Gradient table editor are introduced
DTI computation: one-click solution DTI computation, Color Mapping, Anisotropy analysis, ADC map, fiber tracking etc. can be finished in few minutes just by one click
Dxx Dxy Dxz Dyy Dyx Dyz Dzx Dzz Dzy DTI Computation: tensor matrix
DTI Computation: other-results Primary Axis FA x y z 2nd Axis x y z RA Shortest Axis x y z VR Eigen Values Eigen Vectors Color Maps Anisotropy
DTI Computation: ADC map Original Images (Multi-Scans) ADC Map for every gradient
Region of Interesting (ROI) Tools • Built-in ROI tools • Variety drawing tools, 3D ROI displaying, ROI combination makes complex-ROI drawing possible • Statistic analysis within ROIs for orthogonal views • ROI file management is available
ROI Tools: Interface Options Shapes Operations Files Statistics
ROI Drawing Tools ROI (Region Of Interesting) drawing tools • Different Shape: Rectangle Polygon Ellipse • Multiple-ROI: • Multiple Slices ROI (3D ROI): Slice 120 Slice 121 Slice 123 Slice 124
Multiple ROIs operations A + B ROI - A OR A x B AND NOT ROI - B Combination A - B Original Result
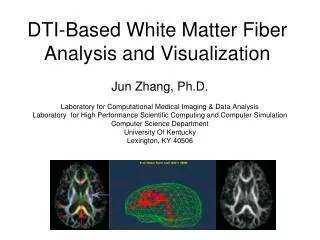
Fiber Tracking • Fiber tracking can be finished in a few minutes • Fiber selection by multi-ROIs combination • Visualization in 2D or 3D views • Fiber data file management is available
Fiber Tracking: Interface display options Fiber selection Fiber color assignment ROI shape ROI combination Fiber-ROI files Fiber-ROI statistics File commands
Fiber Tracking: visualization Selected tracts can be displayed in 3D and 2D orthogonal views simultaneously using user assigned color.
Fiber Tracking: visualization Selected tracts can also be displayed in 2D multi-slices mode.
Fiber Selection: by ROI combination ROI - B ROI - A Fiber can be selected by multi-ROIs combinations such as AND, OR and NOT. This example shows the fibers passing through ROI-A but not ROI-B
ROI - A ROI - A ROI - B ROI - B ROI - B ROI - A Fiber Selection: more details Q: Why do we need it? A: Select (and visualize) the interested fibers within the whole fiber data record • Intersection (AND) • Union (OR) • Exclusion (NOT) A B A B A - B
FA < 0.4 >70º Fiber Tracking: Algorithm • Basically, the algorithm is on FACT method (Mori et al, 1999) • Tracking starts when FA > threshold • Tracking stops when FA < threshold or tract changed its direction sharply
Visualization • Visualizing images in 2D-orthogonal views and 3D view • 3D viewing direction changing freely • Zoom in, zoom out interactively for 3D view • Multi-slices image viewing, image scaling, image data and profile viewing are available
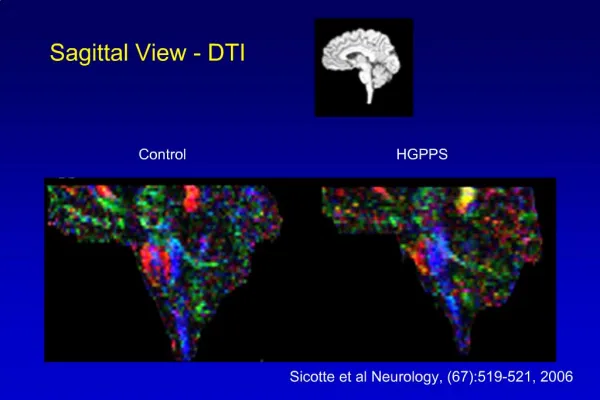
Visualization: 3D and 2D views Axial View 3D View Sagittal View Coronal View
Visualization: image level adjusting Image level adjusting helps the users viewing the details more
Visualization: 3D view • 3D-visualization: • Interactively rotating, zooming and so on. • Slice opacity is adjustable • User-defined fiber color • Synchronized with the 2D orthogonal slice views
Visualization: 3D image opacity Adjustable image opacity makes see-through possible