Download
1 / 13
130 likes | 270 Views
Demand. Elasticity of Demand. Percentage change in Quantity Demanded given a percentage change in Price It represents the responsiveness of consumer reactions to price changes This is called an Elasticity % Change in Quantity Demanded/ % Change in Price. 2.

E N D
Elasticity of Demand • Percentage change in QuantityDemanded given a percentage change in Price • It represents the responsiveness of consumer reactions to price changes • This is called an Elasticity • % Change in Quantity Demanded/ % Change in Price 2
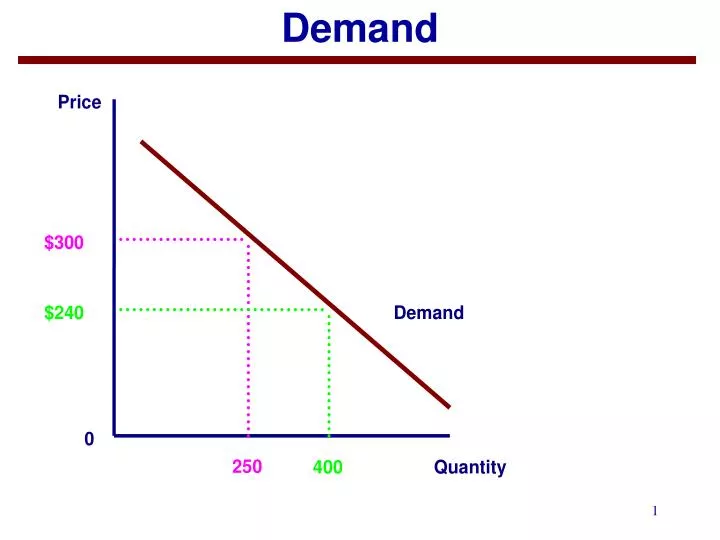
Calculate the Elasticity of Demand • For the price movement from $300 to $240 • Elasticity is 2.0 • This means that a 1% decrease in price will cause a 2.0% increase in quantity demanded (i.e., sales quantity) • Numbers larger than 1 represent a relatively responsive change to price 3
Elasticities of Demand • If the elasticity is greater than 1 • We call that “elastic” or relatively responsive to price changes • If the elasticity is less than 1 • We call that “inelastic” or relatively unresponsive to price changes 4
Determinants of Elasticities • Elasticities vary along demand curve • More elastic at high prices • Consumers respond a lot • Less elastic (more inelastic) at lower prices • Consumers care less • 2. Elasticity is determined by the quality and quantity of available substitutes 5
Elasticities and Total Revenue • Price and Total Revenue move in opposite directions on the elastic portion of the demand curve • Elastic example (2.0) • At the high price of $300 • Total revenue = $75,000 • $300 x 250 • At the low price of $240 • Total revenue = $96,000 • $240 X 400 6
OUTLINE • Introduction • Consumer (Producer) Behavior • Price Value Tradeoffs • An Example • Profit Maximizing Behavior • Summary and Questions
Price/Value Tradeoffs • Consider the impact of Price on PROFIT rather than just on Total Revenue • Assume each unit costs a seller $200 to purchase • And that the elasticity of demand is relatively elastic • That is, consumers can find the same product elsewhere 8
Price/Value Tradeoffs • 3. At the high price of $300 (250 units), total revenue = $75,000 • Profit = $75,000 – ($200*250) • = $25,000 • 4. At the lower price of $240 (400 units), total revenue = $96,000 • Profit = $96,000 – ($200*400) • = $16,000 • Profit is 36% lower even though revenue increased • You not only lowered price on the extra 150 units, you also lowered the price on those you would have sold at $300 9