
Neural Correlates of Depression Treatment in Adolescents: Impacts of Cognitive Behavioral Therapy
This study investigates the neural correlates associated with depression treatment in adolescents through brief cognitive behavioral therapy (CBT). Results show a significant reduction in depressive symptoms as measured by the Beck Depression Inventory (BDI-II) and Children's Depression Rating Scale-Revised (CDRS-R) from pre-treatment to post-treatment and follow-up for the intervention group (PAT-I). Notable changes in brain activity were observed in the subgenual anterior cingulate cortex, amygdala, and hippocampus, areas previously linked to depression. Findings highlight the potential benefits of CBT on adolescent mental health.

Neural Correlates of Depression Treatment in Adolescents: Impacts of Cognitive Behavioral Therapy
E N D
Presentation Transcript
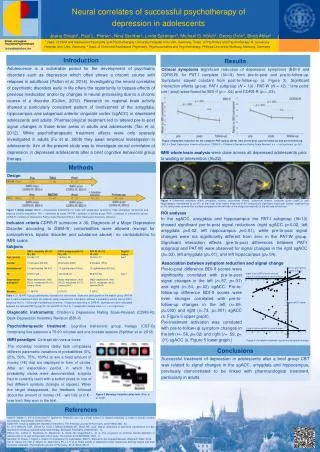
Results Introduction Conclusions Clinical symptoms Significant reduction of depressive symptoms (BDI-II and CDRS-R) for PAT-I complete (N=18) from pre-to-post and pre-to-follow-up. Symptoms stayed constant from post-to-follow-up (s. Figure 3). Significant interaction effects (group: PAT-I subgroup (N = 10) / PAT-W (N = 12) * time point: pre / post) were found for BDI-II (p = .04) and CDRS-R (p = .03). Adolescence is a vulnerable period for the development of psychiatric disorders such as depression which often shows a chronic course with relapses in adulthood (Patton et al. 2014). Investigating the neural correlates of psychiatric disorders early in life offers the opportunity to bypass effects of previous medication and/or by changes in neural processing due to a chronic course of a disorder (Cullen, 2012). Research on regional brain activity showed a particularly consistent pattern of involvement of the amygdala, hippocampus and subgenual anterior cingulate cortex (sgACC) in depressed adolescents and adults. Pharmacological treatment led to altered pre-to-post signal changes in those brain areas in adults and adolescents (Tao et al. 2012). While psychotherapeutic treatment effects were only sparsely investigated in adults (Fu et al. 2008) they await empirical investigation in adolescents. Aim of the present study was to investigate neural correlates of depression in depressed adolescents after a brief cognitive behavioral group therapy. Ziel der vorliegenden Untersuchung war es, neuronale Korrelate des Effekts der Teilnahme an einer KVT in der Gruppe in depressionsrelevanten Arealen zu untersuchen. Successful treatment of depression in adolescents after a brief group CBT was related to signal changes in the sgACC, amygdala and hippocampus, previously demonstrated to be linked with pharmacological treatment, particularly in adults. Neural correlates of successful psychotherapy of depression in adolescents Joana Straub1, Paul L. Plener1, Nina Spröber1, Linda Sprenger3, Michael G. Kölch1, Georg Grön2, Birgit Abler2 1Dept. of Child and Adolescent Psychiatry and Psychotherapy, University Hospital Ulm, Ulm, Germany; 2Dept. of Psychiatry and Psychotherapy III, University Hospital Ulm, Ulm, Germany; 3Dept. of Child and Adolescent Psychiatry, Psychosomatics and Psychotherapy, Philipps-University Marburg, Marburg, Germany Figure 3 Symptom reduction for the complete PAT-I group (N=18) from pre-to-post, post-to-follow-up and pre-to-follow-upBDI-II = Beck Depression Inventory Revision; CDRS-R = Children’s Depression Rating Scale Revised; n.s. = not significant (p>.05) fMRI whole brain analysis were done across all depressed adolescents prior to waiting or intervention (N=22). Methods Design Diagnostic instruments: Children´s Depression Rating Scale-Revised (CDRS-R); Beck-Depression Inventory Revision (BDI-II) Psychotherapeutic treatment:Cognitive behavioral group therapy (CBT-G) comprising five sessions á 75-90 minutes and one booster session (Spröber et al. 2012). fMRI paradigm: Contrast win versus loose Figure 4Differential activation within amygdala, nucleus accumbens (NAcc), subgenual anterior cingulate cortex (sgACC) and hippocampus; thresholded at p<.001 at the voxel level, extent threshold of 60 contiguously significant voxels per cluster, significant at p<.05, family-wise corrected for multiple comparisons the left side of the image corresponds to the left side of the brain. Figure 1 Study design MICHI = Manualized Intervention to Cope with depressive symptoms, Help strenghten ressources and Improve emotion regulation; TAU = treatment as usual; PAT-W = patients of waiting group; PAT-I = patients of intervention group; CDRS-R = Children‘s Depression Rating Scale Revised; BDI-II = Beck Depression Inventory- Revision. ROI analyses In the sgACC, amygdala and hippocampus the PAT-I subgroup (N=10) showed significant pre-to-post signal reductions (right sgACC p=0.02, left amygdala p=0.02, left hippocampus p=0.01), while pre-to-post signal changes were not significantly different from zero in the PAT-W group. Significant interaction effects (pre-to-post differences between PAT-I subgroup and PAT-W) were observed for signal changes in the right sgACC (p=.03), left amygdala (p=.01), and left hippocampus (p=.04). Inclusion criteria CDRS-R sumscore ≥ 36; Diagnosis of a Major Depressive Disorder according to DSM-IV; comorbidities were allowed (except for schizophrenia, bipolar disorder and substance abuse); no contradictions to fMRI scans Subjects Association between symptom reduction and signal change Pre-to-post difference BDI-II scores were significantly correlated with pre-to-post signal changes in the left (r=.57, p=.01) and right (r=.54, p=.02) sgACC. Pre-to-follow-up difference BDI-II scores were even stronger correlated with pre-to-follow-up changes in the left (r=.69, p=.002) and right (r=.73, p=.001) sgACC (s. Figure 5 upper graph). Pre-treatment activation was correlated with pre-to-follow-up symptom changes in the left (r=-.56, p=.02) and right (r=-.59, p= .01) sgACC (s. Figure 5 lower graph.) pre-to-post sgACC signal change ■ pre-to-post BDI-II score change Δ pre-to-follow-up BDI-II score change Table 1 Of 18 PAT-I group patientswho received the intervention, eight also participated in the waitlist group (PAT-W N=12) before treatment while ten patients solely received the intervention without a preceding waiting period (PAT-I subgroup N=10).1 Edinburgh Handedness Inventory; 2Diagnosis according to DSM-IV; significances were calculated between the reduced PAT-I group (N=10) and PAT-W (N=12). a independent sample t-test; n.s. = not significant pre sgACC signal Δ pre-to-follow-up BDI-II score change Figure 5 Correlation between signal and symptom change The monetary incentive delay task compasses different parametric variations of probabilities (0%, 25%, 50%, 75%, 100%) to win a fixed amount of money (1€) that are displayed in form of circles. After an expectation period, in which the probability circles were demonstrated, subjects had to correctly react with a button press to one of two different symbols (triangle or square). When the target disappeared, the feedback followed about the amount of money (1€ - win trial or 0 € - lose trial) they won in the trial. Figure 2 Monetary incentive delay task (Abler et al. 2006) References Abler B, Walter H, Erk S, Kammerer H, Spitzer M. Prediction error as a linear function of reward probability is coded in human nucleus accumbens. Neuroimage. 2006;31:790-5. Cullen KR. Imaging adolescent depression treatment. The American Journal of Psychiatry. 2012;169(4):348 - 50. Fu CHY, Williams SCR, Cleare AJ, Scott J, Mitterschiffthaler MT, Walsh ND, et al. Neural responses to sad facial expressions in major depression following cognitive behavioral therapy. Biological Psychiatry. 2008;64:505 - 12. Patton GC, Coffey C, Romaniuk H, Mackinnon A, Carlin JB, Degenhardt L, et al. The prognosis of common mental disorders in adolescents: A 14-year prospective cohort study. The Lancet. 2014;383(9926):1404 - 11. Sproeber N, Straub J, Fegert J, Koelch M. Depression im Jugendalter: MICHI - Manual für die Gruppentherapie. Weinheim: Beltz; 2012. Tao R, Calley CS, Hart J, Mayes TL, Nakonezny PA, Lu H, et al. Brain activity in adolescent major depressive disorder before and after fluoxetine treatment. The American Journal of Psychiatry. 2012;169(4):381-8.


