Understanding Probability in Multivariate Statistical Data
This guide explores the fundamentals of calculating probabilities in statistical data tables involving multiple variables. It outlines the importance of identifying the total population and provides practical examples, including probabilities related to smoking habits from survey data. For instance, the chance of selecting a smoker or a female non-smoker is detailed, showing how surveys can generate useful statistical insights. Additional exercises are included to strengthen understanding of probabilistic concepts in various scenarios.

Understanding Probability in Multivariate Statistical Data
E N D
Presentation Transcript
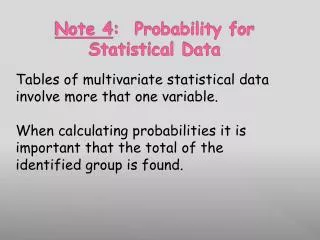
Note 4: Probability for Statistical Data Tables of multivariate statistical data involve more that one variable. When calculating probabilities it is important that the total of the identified group is found.
Example 1:A survey was conducted to question people about their smoking habits. 640 360 380 620 1000 Find the probability that a randomly selected person is a smoker 380/1000 Find the probability that a randomly selected person is a female, non-smoker 210/1000
A survey was conducted to question people about their smoking habits. 640 360 380 620 Find the probability that a female selected is a non-smoker? 210/360 If 15% of all smokers roll their own cigarettes, how many of the people surveyed would you expect to roll their own? = 57 people 0.15 x 380
Example 2: A group of 50 people were asked there favourite number of a die. If a person is chosen at random. Find the probability the persons favourite number: is 1 is a prime number is a number less than 3. P(1)=0 P(prime)= P(number < 3 ) =
Page 277 Exercise L