Download
1 / 29
300 likes | 507 Views
Climate Sensitivity of Boreal Forest Ecosystem Carbon Dynamics. A. David McGuire and Colleagues BNZ LTER Annual Symposium 5 March 2009. Modeling the impacts of multiple factors on the terrestrial carbon budget of the pan-boreal region. HR. NET C EXCHANGE (NEE). Atmos. CO 2 Concentration.

E N D
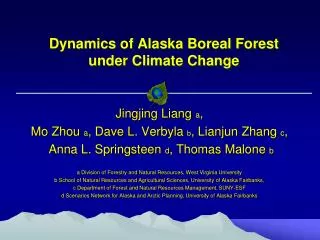
Climate Sensitivity of Boreal Forest Ecosystem Carbon Dynamics A. David McGuire and Colleagues BNZ LTER Annual Symposium 5 March 2009
Modeling the impacts of multiple factors on the terrestrial carbon budget of the pan-boreal region
HR NET C EXCHANGE (NEE) Atmos. CO2 Concentration NPP Conversion Emissions Product Decay Atmos. Chem. (O3, NDEP) Climate (NIRR, TAIR, PREC) TEM Carbon Pools 1 yr Vegetation, Soils (Ecozone) 10 yr 100 yr Disturbance / Land Use (LCLUC) DOC Export Product Pools NET ECOSYTEM C BALANCE (NECB)
DOC Leaching Estimates of TEM For Major Arctic Rivers compared with empirical LOADEST Model Estimates
Modeling the impacts of disturbance on the terrestrial carbon budget NECB (TgC yr-1), N. America, 1997 – 2006
NDVI trends show boreal browning From Bunn, Lloyd, and Goetz. Associations between tree growth, NDVI, and climate in Boreal forests. American Geophysical Union, December 2006.
NEP vs. NPP and HR in North American Boreal Forests NPP vs. Precipitation minus ET (PME) in North American Boreal Forests
Climatic controls on NPP of white spruce forests: insights from dendrochronology • Negative correlations between growth and warming prevail in white spruce forests in Alaska. • N=25 sites studied by BNZ P.I.s (Wilmking, Barber, Juday, Lloyd, Fastie) • 28% have predominantly positive response to warming, 72% have predominantly negative response to warming. • There is no clear relationship between climate and the location of negatively responding sites.
The frequency of trees responding positively to warming increases with longitude in the Brooks Range (r=0.903, P=0.005; Wilmking et al. 2005).
Climatic controls on NPP of white spruce forests: insights from dendrochronology White spruce response to climate varies significantly over time within some spatial regions, but not in low-elevation interior sites.
Climatic controls on NPP of white spruce forests: insights from dendrochronology White spruce response to climate varies significantly over time within some spatial regions, but not in low-elevation interior sites . Response to climate varies significantly within populations of white spruce, and in many cases within-population variation exceeds variation among regions.
Climatic controls on NPP of white spruce forests: insights from dendrochronology Stand-level processes also control NPP in white spruce forests, and in some cases these may have opposing effects to processes occurring at the level of individual tree growth.
Climatic controls on NPP of white spruce forests: demographic perspective
Band Data NPP estimate, by site Inventory Data, beware 1993 NOTE: 2003 band data was actually collected 5/2004, so NOT using 2003 and 2004.
Band Data NPP estimate, by site Inventory Data, beware 1993
Uplands Floodplains
Climatic controls on NPP of white spruce forests: demographic perspective • Trees in size class 3 and 4 contribute the most to NPP (size class 2 somewhat important in UP3) . • FP4 site NPP ranges from 500-1000 kg C/ha/yr, while UP3 site NPP ranges from 200-1400 kg C/ha/yr. • NPP within all FP4 sites seems to be correlated; NPP within UP3 sites seems to be correlated, but there DOES NOT seem to be correlation BETWEEN FP4 and UP3 sites. • FP4 size class 3 and 4, and total tree NPP seem to be negatively correlated to summer air temperature and positively correlated to August pdsi. • UP3 size class 3 and 4, and total tree NPP seem to be negatively correlated to May air temperature, june precipitation, previous May pdsi, 5cm soil temperature in May, June and July, and positively correlated to August pdsi and previous August pdsi.
Climatic controls on NPP of white spruce forests: experimental perspective
Hypotheses • The initial hypotheses were: • (1) forest growth in upland birch/aspen (Betula neoalaskana Sarg./ Populus tremuloides Michx.) stands is strongly controlled by summer rainfall, and • (2) forest growth in balsam poplar/white spruce (Populus balsamifera L./ Picea glauca (Moench) Voss) ecosystems on the floodplain will show no relationship to summer rainfall due to the influence of ground water, related to river flow dynamics, on soil moisture recharge.
Implication for prediction of future forest growth • Two scenarios can be derived from this research. • First for upland sites very little or no change in tree growth is indicated. Spring snowmelt and summer rainfall will sufficiently replenish soil water to maintain the current levels of tree growth. • Tree growth on the floodplain will have greater dependence on rainfall events assuming no change in the soil water capillary dynamics. If the growing season continues to lengthen the duration of a potential moisture deficit will lengthen and the growth capability on the floodplain sites will decrease.