Download
1 / 14
140 likes | 264 Views
This analysis explores the intricate concepts of Gross Income (GI), Taxable Income (TI), and Cash Flow After Tax (CFAT) to provide a thorough understanding of after-tax economic performance. It outlines how gross income is derived from various sources, the effect of operating expenses and taxes on taxable income, and the calculation of net profit after taxes (NPAT). The discussion also highlights the significance of capital gains, depreciation recovery, and losses, illustrating how they impact taxable income. This guide is essential for corporate financial strategy and tax planning.

E N D
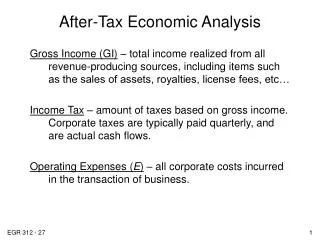
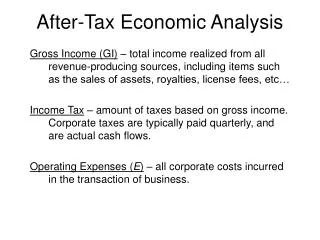
After-Tax Economic Analysis Gross Income (GI) – total income realized from all revenue-producing sources, including items such as the sales of assets, royalties, license fees, etc… Income Tax – amount of taxes based on gross income. Corporate taxes are typically paid quarterly, and are actual cash flows. Operating Expenses (E) – all corporate costs incurred in the transaction of business.
After-Tax Economic Analysis Taxable Income (TI) – the amount upon which taxes are based. TI = GI – E – D Where D is depreciation defined in previous lecture. Tax Rate (T) – percentage of TI owed in taxes. This rate is graduated, based on TI. Net Profit after taxes (NPAT) – amount remaining each year when income taxes are subtracted from taxable income. NPAT = TI – TI(T)
After-Tax Economic Analysis Graduated tax rate schedule
After-Tax Economic Analysis Average Tax Rate – because the marginal tax rate varies as TI varies, the average tax rate is calculate as: Ave tax rate = total taxes / TI Effective Tax Rate (Te) – the total rate paid by corporations, including federal, state and local taxes. Note state taxes can be deducted from federal taxes. So: Te = state rate + (1-state rate)( federal rate)
After-Tax Economic Analysis CFBT – vs – CFAT Cash flow before tax (CBFT) – all cash flows throughout the year without considering taxes. Note, all our PW, FW, AW analysis to this point have been CBFT cash flows. CBFT = GI – E – P – S where P is initial investments and S is salvage. Cash flow after tax (CFAT) – includes the cash flow impact of taxes. CFAT = CFBT - taxes
After-Tax Economic Analysis CFBT – vs – CFAT Knowing CFAT = CFBT – taxes; Taxes are calculated taking depreciation (D) into account, however depreciation is not a cash flow, but taxes are. Taxes = TI(Te) TI = GI – E – D CFAT = GI – E – P + S – (GI – E – D)(Te)
After-Tax Economic Analysis Example 17.3 from Book
After-Tax Economic Analysis Capital Gains (CG) Occurs when selling price is greater than first cost: Capital gain = selling price – first cost CG = SP – P Depreciation Recovery (DR) Occurs when a depreciable asset is sold for more than the current book value. Depreciation recapture = selling price – book value DR = SP – BVt Capital Loss (CL) Occurs when a depreciable asset is disposed of for less than its current book value. CL = BVt - SP
After-Tax Economic Analysis DR CG 0$ BV P SP When selling price exceeds first cost then both a capital gain and a depreciation recovery occur. DR 0$ BV SP P When selling price exceeds book value but is less than he first cost then a depreciation recovery occurs.
After-Tax Economic Analysis CL 0$ SP BV P When selling price is below book value a capital loss occurs.
After-Tax Economic Analysis Considering capital gains, depreciation recovery and capital losses, TI = gross income – expenses – depreciation + depreciation recapture + capital gains – capital loss TI = GI – E – D + DR + CG - CL
After-Tax Economic Analysis After-Tax PW and AW Analysis Relationship between before-tax MARR and after-tax MARR: Before-tax MARR = Te for corporations is often between 30 and 50%. After-tax MARR 1 - Te
After-Tax Economic Analysis After-Tax PW and AW Analysis Approach 1: Find the PW or AW of an alternative using the CFAT and the After-tax MARR. That alternative with the largest PW (AW) is chosen. Note, PW must use LCM (least common multiple of years).
After-Tax Economic Analysis Using cash flows from Example 17.3, and an after-tax MARR of 7%, the PW Of this alternative is: PW = - $500,000 + $110,000(P/F, 7%, 1) + $133,100(P/F, 7%, 2) + $108,460(P/F, 7%, 3) + $ 93,676(P/F, 7%, 4) + $ 93,676(P/F, 7%, 5) + $232,588(P/F, 7%, 6)