Download
1 / 37
370 likes | 529 Views
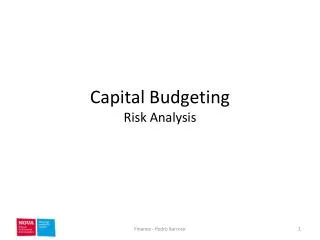
Lecture 9 Capital Budgeting and Risk. Managerial Finance FINA 6335 Ronald F. Singer. Topics Covered. Measuring Betas Capital Structure and COC Discount Rates for Intl. Projects Estimating Discount Rates Risk and DCF. Company Cost of Capital.

E N D
Lecture 9Capital Budgeting and Risk Managerial Finance FINA 6335 Ronald F. Singer
Topics Covered • Measuring Betas • Capital Structure and COC • Discount Rates for Intl. Projects • Estimating Discount Rates • Risk and DCF
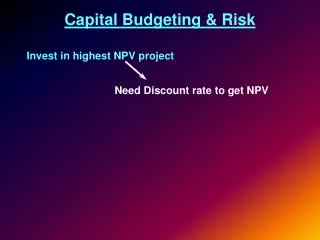
Company Cost of Capital • A firm’s value can be stated as the sum of the value of its various assets.
Company Cost of Capital • A company’s cost of capital can be compared to the CAPM required return. 13 5.5 0 SML Required return Company Cost of Capital Project Beta 1.26
Measuring Betas • The SML shows the relationship between return and risk. • CAPM uses Beta as a proxy for risk. • Beta is the slope of the SML, using CAPM terminology. • Other methods can be employed to determine the slope of the SML and thus Beta. • Regression analysis can be used to find Beta.
Measuring Betas Hewlett Packard Beta Price data - Jan 78 - Dec 82 R2 = .53 B = 1.35 Hewlett-Packard return (%) Slope determined from 60 months of prices and plotting the line of best fit. Market return (%)
Measuring Betas Hewlett Packard Beta Price data - Jan 83 - Dec 87 R2 = .49 B = 1.33 Hewlett-Packard return (%) Slope determined from 60 months of prices and plotting the line of best fit. Market return (%)
Measuring Betas Hewlett Packard Beta Price data - Jan 88 - Dec 92 R2 = .45 B = 1.70 Hewlett-Packard return (%) Slope determined from 60 months of prices and plotting the line of best fit. Market return (%)
Measuring Betas Hewlett Packard Beta Price data - Jan 93 - Dec 97 R2 = .35 B = 1.69 Hewlett-Packard return (%) Slope determined from 60 months of prices and plotting the line of best fit. Market return (%)
Measuring Betas A T & T Beta Price data - Jan 78 - Dec 82 R2 = .28 B = 0.21 A T & T (%) Slope determined from 60 months of prices and plotting the line of best fit. Market return (%)
Measuring Betas A T & T Beta Price data - Jan 83 - Dec 87 R2 = .23 B = 0.64 A T & T (%) Slope determined from 60 months of prices and plotting the line of best fit. Market return (%)
Measuring Betas A T & T Beta Price data - Jan 88 - Dec 92 R2 = .28 B = 0.90 A T & T (%) Slope determined from 60 months of prices and plotting the line of best fit. Market return (%)
Measuring Betas A T & T Beta Price data - Jan 93 - Dec 97 R2 = ..17 B = .90 A T & T (%) Slope determined from 60 months of prices and plotting the line of best fit. Market return (%)
Beta Stability % IN SAME % WITHIN ONE RISK CLASS 5 CLASS 5 CLASS YEARS LATER YEARS LATER 10 (High betas) 35 69 9 18 54 8 16 45 7 13 41 6 14 39 5 14 42 4 13 40 3 16 45 2 21 61 1 (Low betas) 40 62 Source: Sharpe and Cooper (1972)
Capital Budgeting & Risk • Modify CAPM • (account for proper risk) • Use COC unique to project, • rather than Company COC • Take into account Capital Structure
Company Cost of CapitalSimple Approach • Company Cost of Capital (COC) is based on the average beta of the assets. • The average Beta of the assets is based on the % of funds in each asset.
Company Cost of CapitalSimple Approach Company Cost of Capital (COC) is based on the average beta of the assets. The average Beta of the assets is based on the % of funds in each asset. Example 1/3 New Ventures B=2.0 1/3 Expand existing business B=1.3 1/3 Plant efficiency B=0.6 AVG B of assets = 1.3
Capital Structure Capital Structure - the mix of debt & equity within a company Expand CAPM to include CS R = rf + B ( rm - rf ) becomes Requity = rf + B ( rm - rf )
Capital Structure & COC COC =rportfolio = rassets rassets = WACC = rdebt (D) + requity (E) (V) (V) Bassets = Bdebt (D) + Bequity (E) (V) (V) IMPORTANT E, D, and V are all market values requity = rf + Bequity ( rm - rf )
Capital Structure & COC Expected Returns and Betas prior to refinancing Expected return (%) Requity=15 Rassets=12.2 Rrdebt=8 Bdebt Bassets Bequity
Pinnacle West Corp. Requity = rf + B ( rm - rf ) = .045 + .51(.08) = .0858 or 8.6% Rdebt = YTM on bonds = 6.9 %
International Risk Source: The Brattle Group, Inc. s Ratio - Ratio of standard deviations, country index vs. S&P composite index
Unbiased Forecast • Given three outcomes and their related probabilities and cash flows we can determine an unbiased forecast of cash flows.
Asset Betas Cash flow = revenue - fixed cost - variable cost PV(asset) = PV(revenue) - PV(fixed cost) - PV(variable cost) or PV(revenue) = PV(fixed cost) + PV(variable cost) + PV(asset)
Risk,DCF and CEQ Example Project A is expected to produce CF = $100 mil for each of three years. Given a risk free rate of 6%, a market premium of 8%, and beta of .75, what is the PV of the project?
Risk,DCF and CEQ Example Project A is expected to produce CF = $100 mil for each of three years. Given a risk free rate of 6%, a market premium of 8%, and beta of .75, what is the PV of the project?
Risk,DCF and CEQ Example Project A is expected to produce CF = $100 mil for each of three years. Given a risk free rate of 6%, a market premium of 8%, and beta of .75, what is the PV of the project? r = r f + B(r m – r f) = 6 + 0.75 (8) = 12 %
Risk,DCF and CEQ Example Project A is expected to produce CF = $100 mil for each of three years. Given a risk free rate of 6%, a market premium of 8%, and beta of .75, what is the PV of the project? Now assume that the cash flows change, but are RISK FREE. What is the new PV? r = r f + B(r m – r f) = 6 + 0.75 (8) = 12 %
Risk,DCF and CEQ Example Project A is expected to produce CF = $100 mil for each of three years. Given a risk free rate of 6%, a market premium of 8%, and beta of .75, what is the PV of the project?.. Now assume that the cash flows change, but are RISK FREE. What is the new PV?
Risk,DCF and CEQ Since the 94.6 is risk free, we call it a Certainty Equivalent of the 100.
Risk,DCF and CEQ Example Project A is expected to produce CF = $100 mil for each of three years. Given a risk free rate of 6%, a market premium of 8%, and beta of .75, what is the PV of the project?.. Now assume that the cash flows change, but are RISK FREE. What is the new PV? The difference between the 100 and the certainty equivalent (94.6) is 5.4%…this % can be considered the annual premium on a risky cash flow
Risk,DCF and CEQ Example Project A is expected to produce CF = $100 mil for each of three years. Given a risk free rate of 6%, a market premium of 8%, and beta of .75, what is the PV of the project?.. Now assume that the cash flows change, but are RISK FREE. What is the new PV?
Risk,DCF and CEQ • The prior example leads to a generic certainty equivalent formula.