Download
1 / 39
390 likes | 510 Views
Explore The DCAO history, staff, education offerings, research areas, and goals in atmospheric and oceanic sciences. Learn about current projects and collaborations. Join us at the Kick Off Meeting on November 4 and 5 in Buenos Aires, Argentina.

E N D
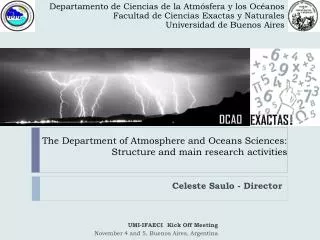
The Department of Atmosphere and Oceans Sciences: Structure and main research activities Celeste Saulo - Director UMI-IFAECI Kick Off Meeting November 4 and 5, Buenos Aires, Argentina
History • The DCAO has been created in 1958, within the Faculty of Exact and Natural Sciences, University of Buenos Aires. • Graduate level in Atmospheric Sciences since 1953 • Graduate level in Oceanography since 1993 Staff • 17 Full-time professors (*) • 11 Part-time professors (*) • 11 Full-time professor assistants (*) • 17 Part-time professor assistants • (*) many are also CONICET research staff, and work either at CIMA, DCAO or SHN
Education: Degree and postgraduate levels • Licencee in Atmospheric Sciences (6 years) • Licencee in Oceanography (6 years) • Bachelor in Atmospheric Sciences (3,5 years - with 4 orientations) • PhD in Atmospheric Sciences • PhD in Oceanography PhDs 18 Atmospheric Sc. Oceanography 30
General research areas • Weather Analysis and forecasting • Diagnostic and modeling studies of atmospheric and oceanic (*) climate variability • Climate change and its impacts • Environmental Meteorology and Oceanography • Land-sea-air-criosphere interactions • Remote sensing applied to the oceans and the atmosphere • Study and modeling of the oceans and seas (*) Scientific production, according to number of publications in journals
Paleo and neo climate change over South- American from subtropical to high latitudes Study of Droughts and Floods in southeastern South America Precipitation and temperature climatology (constructed from long-term observational data) applied to: Long term fluctuations (interannual and decadal variability) and their relation with SST and low frequency forcings Temperature Extremes Precipitation Extremes Heat/cold waves Validation of current climate derived from RCM and GCMs Crop yields Potential impacts of climate change Regional climate modeling (*) Characterization of The Rio de la Plata estuary climate and variability (*) Characterization of the Western South Atlantic climate and variability Diagnostic and modeling studies of atmospheric and oceanic climate variability and climate change
Paleo and neo climate change over South- American from subtropical to high latitudes • GENERAL OBJECTIVE: to understand the forcing involved in climatic changes and to investigate climate and its variability for the instrumental and pre instrumental periods, over the southern cone of South America, and teleconnections with others regions METHODOLOGY: • The analysis of instrumental and proxy data • The output of re-analysis models of atmospheric circulation and climatic and paleoclimatic models Experiments and simulations using paleoclimate GCMs and energy balance models • Solar system 3D models • Time series and climatic variable fields analyzed by statistic methodologies in time series analysis and multivariate methods LOTRED-SA “Coordinating Committee” : Long-Term climate REconstruction and Dynamics of (southern) South America: A collaborative, high-resolution multi-proxy approach (within IGBP-PAGES) Rosa Compagnucci and collaborators
Study of Droughts and Floods in southeastern South America Applied Climatology Group, Vargas and collaborators
Detection of intraseasonal signal for maximum and minimum temperature PC 1 for the maximum (a) and minimum (b) temperatures for the reference stations. Relationshipbetweensurface air temperatureand MJO Average fields of maximum winter (JJA) temperature anomalies with amplitude greater than the upper tercile for MJO phases. Applied Climatology Group, Vargas and collaborators
Precipitation and temperature climatology and its relationship with crop yields in main producer regions around the world. Applied Climatology Group, Vargas and collaborators
Blockingevents at 70ºW and itsrelationshipwithprecipitation and temperatureanomalies Winter Spring Relationshipwithprecipitation (r>1= above normal precip) T anomalies
Antarctica plays an important role in the global climate, especially in the heat and water balance. Some links with the austral Southern South America’s temperatures are analyzed taking into account spatial homogeneity of the records in different seasons Monthly temperature series of Southern South America and Antarctic Peninsula analyzed Temporal variability analysis Temporal characteristics of the mentioned series and SAM index were analyzed too, considering different variability modes ( wavelets analysis) a Cluster analysis results b Local wavelet power spectrum for (a) Esperanza (b) Trelex Contour levels are chosen so that wavelet power is above the 25th percentile (blue), 50th p (green), 75th pe (light green), and 95th p (red). Black contour is the 10% significance level, using a white-noise background spectrum. The cross-hatched region indicates the ‘‘cone of influence’’, • The cluster analysis shows a possibly strong influence of a spring circulation pattern that links Antarctica and eastern Southern South America • Different variability modes were analyzed with wavelets. The results are congruent with previous work that analyzed temperature indices of Southern South America and found significant relationship with SAM index, with a common 8-year signal in spring • Some changes can be observed in the frequency behaviour during the 1990s that must be analyzed When summer, autumn and winter series were analyzed, the Antarctic stations and the South America stations (specially the stations at the Atlantic coast) were cleared separated as a first step. On the other hand, when spring series were analyzed, the South American stations along the Atlantic coast remained in the same group with the Antarctic ones. When a third grouping was allowed in the analysis, the same situation was observed
Changes in Climate at High Southern Latitudes: A Unique Daily Record at Orcadas Spanning 1903-2008 • The length of the season over which atmospheric temperatures exceed 0°C has substantially increased. • Variability is greater relative to the trends in colder seasons, but the period since 1982 appears to be warmest throughout nearly the entire year, including the late fall and winter season of April-August Fig. Mean annualcycle of temperatures at Orcadas over 20-yr intervalsbeginning in 1903. A 10-day smoothing has beenapplied. • Summerseason • Shape of thedistributionisnearlyconstant • Mean temperatureshavesystematicallyshifted in recentdecades Fig. Distribution of frequencies of observations of daily temperatures during the summer season (Dec-Jan-Feb) for each 20 year period since 1903. One degree bins have been used as shown. Matilde Rusticucci and collaborators
Comparison of observed daily extreme temperature events in Southeastern South America and RCM simulations Maximum Temperature Percentile 95th January Differences RCM-OBS Minimum Temperature Percentile 5th July Differences RCM-OBS Period 1992-2000 Matilde Rusticucci and collaborators
Tucumán Temporal Variability November WET CONDITION Monthly accumulated extreme rainfall greater than 75th daily percentile . December Salta DRY CONDITION AnnualAmount of Dry days Index Penalba and collaborators
Covariability between daily intensity of extreme rainfall (DIER) and Sea Surface Temperature Secondmode 17% (Singular ValueDescomposition) Austral Spring SON DIER correlation of the second mode Penalba and collaborators
1000 hPa Z anomalies Weather Type Classification WT1, WT2 and WT4 have the highest contribution (significant) to dry days in the core region Penalba and collaborators
Meso and large scale circulation in the SWA Ocean Results Ocean circulation over the Zapiola Rise (45W,45S) shows large interannual variability (Saraceno et al, DSR 2009) Work in progress Contribution of mesoscale eddies to the Meridional Overturning Circulation in the Brazil-Malvinas Confluence region Figure 1: Colors indicate the bathymetry in the Argentinean Basin between 4500m and 6000m depth. Thin black lines indicate f/H isocontours (units –1x10⁻⁸ m-1s-1). The closed contours range from –2.1 x10⁻⁸m-1s-1 to –1.92x10⁻⁸m-1s-1. The mean positions [Saraceno et al., 2004] of the Subtropical Front (STF) and the Subantarctic Front (SAF) are indicated by solid black and solid redlines, respectively. The positions of these two fronts correspond, also respectively, to the southern limit of the South Atlantic Current and to the northern limit of the Antarctic Circumpolar Current. Vector speeds estimated from the trajectories of profilers pf3900111 (red arrows) and pf3900110 (black arrows) are indicated. The profiler starting points are indicated by solid dots. The vector scale (bottom-left corner) is common to both profilers. Saraceno and collaborators
Climate Change impacts • To evaluate some aspects of the vulnerability that climate change causes in a rural system (Iberá wetlands) and in a human system (Metropolitan area of Buenos Aires city) analyzing the atmospheric physical processes involved and preparing future climate scenarios based on the information provided by the global climate models (GCMs) which best represent regional climate. • To analyze interaction processes between social and climate dynamics in semi-wet and arid regions in Chaco Plains • So study the relationship between observed climate change (according to precipitation changes) and social vulnerability, adaptation of population, socio-economic structure in different time and spatial scales.
The hydrologic regime of the Iberá wetlands and the potential impacts of Climate Change The Variable Infiltration Capacity (VIC) hydrology model is used to simulate the streamflow annual cycle of the CorrienteRiver at the outlet of the Iberá wetlands. Regional temperature and precipitation changes are derived from the ECHAM5/MPI-OM GCM for three different emissions scenarios and time slices during the 21st century. Monthly mean simulated (dashed lines) and observed (solid lines) streamflows at (a) Los Laureles for the 1990-1999 decade (m3/s).
Annual changes in temperature (°C) , precipitation (%) and streamflow (%) for the Iberá wetlands relative to 1990-1999 period temperature rainfall Almost all scenarios agree in showing an increment in runoff. Results also indicate that precipitation rather than temperature has the major effect in runoff changes. streamflow
Temporal variability of the Buenos Aires urban heat island (UHI) This study explores the statistical characteristics and temporal variability of the UHI intensity in Buenos Aires using 32-year surface meteorological data with 1-h time intervals. The interannual variability and the seasonal variation of the UHI for the main synoptic hours are studied for a longer record of 48 years associated to changes in meteorological factors as wind speed and cloud amount. Hourly frequency distribution of “inverse” (UHI<0°C) and extreme (UHI>4°C) heat islands Hourly variations of UHI (°C) Mean (squares) and standard deviations (bars) The intensity of the UHI depends on many factors and exhibits large variability with the time of day. It is a predominantly nocturnal phenomeon. Negative values, i.e. “inverse heat islands” can be seen at all hours although they occur much more often during the afternoon. Inés Camilloni and collaborators
Temporal variability of the annual mean UHI for the main synoptic hours Decadal variability of the daily cycle of the UHI Evolution of the Buenos Aires Metropolitan area population Although Buenos Aires population had a persistent increase since the beginning of the 20th century, the nocturnal UHI effect has been decreasing since 1960. Both decadal and interannual variability analyses show a reduction of the nocturnal UHI. Cloud cover data show a decline of near clear-sky conditions during nighttime that is accompanied by a negative trend in the calm frequencies. Both changes are physically consistent with the reduction in the UHI intensity. Inés Camilloni and collaborators
Analysis and modelling of dynamical processes associated with extratropical cyclones Short range weather forecasts: numerical experiments and sensitivity studies using WRF and BRAMS models Ensemble generation, data assimilation and probabilistic short range forecasts Wind energy Mesoscale convective systems Simulation Tracking Associated severe weather Characterization of synoptic environment Remote sensing techniques Weather analysis and forecasting (*)Applications
Coastal Cyclones • Coastal cyclones affecting the Atlantic coast of the southern South America may produce several damages, particularly some of them that become explosive during a certain phase of the life cycle. • ¿Which is the characteristic 3D thermal vertical structure of these cyclones? ¿How is its temporal evolution? • ¿Does it exist a relation between the cyclone depth of the cyclones and diabatic processes? Sea level pressure Campetella and collaborators
Generation of low level wind fields from an atmospheric model to be used in planning of electricity dispatch • To improve the knowledge of the “wind” resource in Patagonia. • To develop a tool based on the WRF numerical model for representing low-level wind with a confidence level that is acceptable for the Wholesale Power Market Operator. • To estimate amounts of wind energy available for the electricity system based on wind forecasts at each site according to equipment technology and other factors. • To propose a new regulation in order to allow power paying to return the investment. • To evaluate the potential environmental impacts related to wind energy technologies. Bibiana Cerne and collaborators
Preliminary results Windvelocity3 to 5 March2005 00UTC Winddirecction Bibiana Cerne and collaborators
Study of the synoptic patterns that produce severe wind waves in the outer Río de la Plata • Río de la Plata estuary is an important waterway for commercial and passenger transport for Argentina and Uruguay. • Objective: • to understand the development of severe waves in the mouth of the river which affect navigation.
Relationship among: synoptic situation, wind, gusts and maximum wave height in the outer Río de la Plata 6.8 m Above: wind speed (blue), gusts (green) in km h-1 and significant wave height (pink) in m. Below: direction of wind (blue) and waves (pink). for 23-25 August 2005. Mean sea level pressure and 10m wind for 24 August 2005
Improvements of satellite altimetry data over the Patagonian Shelf RESULTS: The main limitation to use satellite altimetry data over the Patagonian shelf is accuracy of tidal models (Saraceno et al, CSR, 2010; Saraceno et al, JGR, 2008) Work in progress Further validation of along-track data and implementation of a regional tide model with data assimilation Fig. 1. Position of the Tide Gauges (magenta dots) and of the crossovers (circles) considered for the comparison between tide models and observed amplitudes and phases. Background: bathymetry (Smith and Sandwell,1997); diagonal lines correspond to the ascending and descending paths of the T/P and J-1 and J-2 missions; the eastern border of the shelf is represented by the 300m isobath( black contour).
Biometeorology • Study of soil – vegetation – atmosphere interactions at plant and canopy scales. • Study of atmospheric processes involved in the dispersion, transport and deposition of airborne pollen at different scales. Biometeorology group, Gassmann and collaborators
Researchfields Aerobiology Agricultural Meteorology Enegy exchange Atmospheric influence on airborne pollen concentration Cultivated surface – atmosphere Monoculture and Intercropping Long range and local scale airborne pollen transport Natural vegetation - atmosphere Plant - atmosphere Animal- atmosphere Biometeorology group, Gassmann and collaborators
Air Quality Objectives: • Assess the air quality in Buenos Aires • Source of urban air pollution • Receptor of regional pollution • Study the contribution of biomass burning to the regional pollution in BA • Analyze the role of the South American Low Level Jet (SALLJ) as transport mechanism Methodology: • Direct and indirect modeling and observations Ulke and collaborators
Direct modeling CATT-BRAMS AOT500nm Compositefor 2002 CJ1_BB Ulke and collaborators
AOT 500 nm monthly means for the whole data and the Chaco Jet 1 sub-sample in 2001- 2005 AERONET CEILAP – BA Total CJ1 Ulke and collaborators
2001-2005 Indirect modeling Trajectory analysis HYSPLIT Winter 2006, surface ClusterAnalysis Ulke and collaborators
National collaborations • Centro de Investigaciones del Mar y la Atmósfera • Servicio MeteorológicoNacional • Servicio de Hidrografía Naval • InstitutoNacional del Agua (INA) • InstitutoNacional de TecnologíaAgropecuaria (INTA) • Instituto Argentino de Nivología, Glaciología y Ciencias Ambientales (IANIGLA) • Other Faculties inside UBA and many other Universities in Argentina
International Collaboration • IRD, IPSL and LMD, France • University of Sao Paulo, Brazil • CPTEC, Brazil • UNAM, Mexico • University of Geneva (UNIGE), Switzerland • University of KwaZulu-Natal • University of Maryland, USA • Oregon State University, USA • CIRES-NOAA, USA • COAS, USA • University of Utah, USA • University of Alabama, USA • University of Castilla La Mancha, Spain
Visit us at:www.at.fcen.uba.ar Thank you very much!