Download
1 / 63

E N D
1. Sentinel Audit: Changes seen and the future of audit for stroke Tony Rudd
3. St Thomas� Hospital
4. St Thomas� Hospital Stroke Care in 1988 Patients admitted under care of any of 17 general physicians to any one of 15 wards
Very little happened acutely
Brain scans difficult to obtain and therefore rarely done
Referred to geriatricians for rehabilitation � long wait
No stroke specialist service either in hospital or community
5. What are the problems that still need solving? Unacceptable variation in the quality of care between hospitals
Variable quality of clinical and managerial leadership
Variable resources provided for stroke care
UK slow to adopt new technologies e.g. Thrombolysis
Still a belief amongst many people (professionals and public) that stroke untreatable disease of old people
6. Early Stroke Audit Results (1998/9) 18% of patients through stroke unit
23% cognitive assessment
44% visual fields recorded
55% rehabilitation goals set
41% G.P. contacted within 3 days of discharge
7. Key Forces for Change Research
Guidelines summarising the research evidence and clinical consensus (RCP Guidelines and NICE Guidelines on Acute Stroke and TIA and NICE Technology Appraisal on alteplase)
National Audit
Sentinel audit
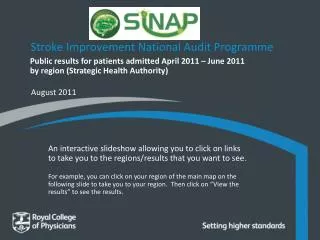
SINAP
Carotid endarterectomy audit
National Audit Office report
National Stroke Strategy
8. Key Forces for Change NICE Quality Standards
Commissioning Outcomes Framework (COF) standards
Performance standards set by Care Quality Commission
Stroke Improvement Programme and Stroke and Cardiac Networks
Stroke Research Network
Public opinion
Media reports
Voluntary sector campaigning
9. Stroke Programme at the RCP Guidelines (3rd edition) �2008
NICE Guidelines on Acute care and TIA
Intercollegiate Guidelines on the rest
National Audit
Organisation of Care
Clinical/Process of Care
Carotid interventions audit
Profession Specific Audit
Acute Continuous Stroke Audit (SINAP)
Change management
Presentations
Workshops
Peer Review
Stroke improvement network links
10. History of Stroke Audit in the UK 1997 Department of Health commissioned national stroke audit
Intercollegiate stroke working party
Audits conducted every 2 years
Structure
Process
(Outcome)
Patient experience (Picker survey)
Primary care audit
Now funded by HQIP
11. Features of Audit 1 100% participation
Run by clinicians
Exceptional level of data quality and completeness
Detailed analysis centrally to allow tailored interrogation of data
Performed every 2 years allowing time for implementation of change
Rapid production of results
12. Individual detailed hospital reports with results benchmarked against national/regional averages
Reports to Strategic Health Authorities, Healthcare Commission, Networks, Department of Health and Parliament
Extensive media coverage because public data of key indicators
Features of Audit 2
13. Other sources of data Primary care � Quality Outcomes Framework (QOF)
Vital signs data
Accelerated metrics for SIP
Routine Hospital Statistics (HES). Used by Dr Foster
14. Results: Stroke unit provision �comparison over time
19. See page 54 of your hospital report
The key nine process indicators were kept the same as in the last two rounds to allow comparisons with these key process figures.
Table gives median % compliance with each indicator, for applicable patients
See page 54 of your hospital report
The key nine process indicators were kept the same as in the last two rounds to allow comparisons with these key process figures.
Table gives median % compliance with each indicator, for applicable patients
20. See page 58See page 58
21. See page 55 for 12 Key Process Indicators
See page 55 for your site�s quartile position
We have added four additional indicators to the previous nine for this round of the audit and removed one. The reasons for are to reflect standards given in the recent NICE Quality Standard for stroke and to include more aspects of stroke care. See page 55 for 12 Key Process Indicators
See page 55 for your site�s quartile position
We have added four additional indicators to the previous nine for this round of the audit and removed one. The reasons for are to reflect standards given in the recent NICE Quality Standard for stroke and to include more aspects of stroke care.
22. Comment: Only 32% of patients received all nine of the original key interventions and only 16% received all of the 12 interventions. What these figures show is that although great progress has been made in improving the delivery of individual standards the chances of a patient receiving high quality care across the whole pathway is low. None of these key indicators should be regarded as optional. These data show that we have a lot of work still to do to ensure that care is uniformly good for all patients in all hospitals at all times.
Comment: Only 32% of patients received all nine of the original key interventions and only 16% received all of the 12 interventions. What these figures show is that although great progress has been made in improving the delivery of individual standards the chances of a patient receiving high quality care across the whole pathway is low. None of these key indicators should be regarded as optional. These data show that we have a lot of work still to do to ensure that care is uniformly good for all patients in all hospitals at all times.
23. How are the data used to influence change? Workshops
Slide toolkits
Publicity
�I�ve been trying to get the trust to offer scanning for stroke patients for 5 years, within a day of receiving the audit report the chief executive had convened a meeting with stroke service and radiology� A stroke physician after publication of performance indicators 2004 audit
Influencing policy at a national level
Influencing policy at SHA level
24. Transforming Stroke care in London:Case for change
25. The scale of the problem of stroke in London In complete opposite to major trauma, most cases of stroke occur in the suburbs � where older people tend to live.
The next two most important factors in stroke are i) ethnicity (there is a 60% greater incidence of stroke within the black African and black Caribbean populations than the white population and ii) social deprivation.
However the actual numbers of people from BME communities having a stroke are not as high as would be expected as there are fewer older black and minority ethnic people in London.
In complete opposite to major trauma, most cases of stroke occur in the suburbs � where older people tend to live.
The next two most important factors in stroke are i) ethnicity (there is a 60% greater incidence of stroke within the black African and black Caribbean populations than the white population and ii) social deprivation.
However the actual numbers of people from BME communities having a stroke are not as high as would be expected as there are fewer older black and minority ethnic people in London.
26. 30-minute blue light ambulance travel time from the hyper-acute stroke units
27. London Stroke Strategy Additional �20m per year for stroke care but only paid if hospitals delivering the required quality
Centralise hyperacute (hyperacute stroke units HASU) care into 8 units situated to provide easy access to the whole population (no more than 30 minutes by ambulance)
All acute stroke patients admitted to HASU. This is not just a thrombolysis service
Further 20 stroke units for on going rehabilitation
Improve community care and longer term rehabilitation
Neurovascular services for patients with TIA
28. London SHA Stroke Strategy Bidding process to provide care
London Clinical Director
Regular inspections to ensure quality of care maintained
Obliged to submit continuous audit
29. 1 year outcomes
30. 1 year outcomes
31. 1 year outcomes
32. Cost-effectiveness analysis of the London Stroke Service: Results based on 6438 strokes per annum
33. Cost-effectiveness analysis of the London Stroke Service: Results based on 6438 strokes per annum
34. Cost-effectiveness analysis of the London Stroke Service: Results based on 6438 strokes per annum
36. Hospital participation and quartiles for participants
37. East of England
49. In 2008 only 1% of all stroke patients received thrombolysis and this figure has now increased to 8%, a significant improvement. The median number of patients treated per hospital in this cohort is 12/year, suggesting that some units are thrombolysing very low numbers. This figure needs to be monitored, as it suggests that the staff may have little experience in its use. It is of note that 22% of thrombolysed patients are over the age of 80. In 2008 only 1% of all stroke patients received thrombolysis and this figure has now increased to 8%, a significant improvement. The median number of patients treated per hospital in this cohort is 12/year, suggesting that some units are thrombolysing very low numbers. This figure needs to be monitored, as it suggests that the staff may have little experience in its use. It is of note that 22% of thrombolysed patients are over the age of 80.
50. Timings � comparison of thrombolysed and non-thrombolysed patients It is perhaps unsurprising that thrombolysed patients are seen and treated much more quickly than non-thrombolysed patients.
It is perhaps unsurprising that thrombolysed patients are seen and treated much more quickly than non-thrombolysed patients.
51. Timings � comparison of hospitals based on percentage of eligible patients thrombolysed The major differences shown here suggests that there is inequity of care not just between thrombolysed and non-thrombolysed patients, but for all patients based on whether they go to a successful thrombolysis centre or not
The major differences shown here suggests that there is inequity of care not just between thrombolysed and non-thrombolysed patients, but for all patients based on whether they go to a successful thrombolysis centre or not
52. The effects of getting to a SU quickly
53. Equity of care across hospitals
55. The New World of SSNAP A wish by certain people to have prospective data collection for stroke
The �need� to collect outcome data
56. Sentinel Stroke National Audit Programme (SSNAP) Replacing all other statutory data collection. Includes data needed for:
NICE QS
NHS Outcomes Framework
Accelerated metrics
Vital signs (except TIA)
COF
Funded by HQIP
57. SSNAP Prospective data collection for all stroke admissions
Web tool for direct data entry
Good data validation systems
Facility for instant local downloads
Uploading facility from other data sets
Quarterly national reporting with benchmarking against national data
Annual public reports
6 month follow-up data entry
Linkage to ONS for mortality data
HES linkage
Option for user defined fields
58. SSNAP: Structure Core data set for all patients
Comprehensive dataset (optional items)
Developed by wide group of stakeholders
Spotlight audits
Audits on areas not covered by the core dataset. E.g. TIA, community rehabilitation
Sprint audits
short specific audits focussing on specific areas of the pathway that are of concern e.g. Therapy intensity, intermediate care.
Organisational audit
Hospital
Community
PROMS
59. SSNAP Reporting Ability to download own data anytime
3 monthly reports benchmarked against national data
Annual public reports � �state of the nation�
Outcomes required by DH
Mortality at 30days and 6 months
Modified Rankin Score at 6 months
Institutionalisation rate at 6 months
60. SSNAP Timetable Some uncertainty
We hope
May 2012 Organisational audit of hospital care
August 2012 Clinical data set starts
SINAP continues until SSNAP starts
1st Spotlight and Sprints audits in year 2
Initial funding 3 years
61. SSNAP Team Intercollegiate Stroke Working Party overseeing the process
Clinicians at RCP in Associate Director Roles
Geoff Cloud, Pippa Tyrrell, Martin James, Tony Rudd
Alex Hoffman, James Campbell, Sara Kavanagh plus a statistician, web developer and admin support
62. SSNAP Risks Funding
Currently debates over data protection and intellectual property
Participation rates
Major burden for clinicians/trusts
Freedom of information act
�Number 10 Openness Agenda�
Technical challenges
63. Conclusions Stroke care has transformed over the last 20 years
Audit has been one of the factors that has driven improvements
No prospect of avoiding monitoring of quality of care that we provide
We are starting a new era of prospective audit
Huge benefits for all if everyone participates