Download
1 / 49
530 likes | 718 Views
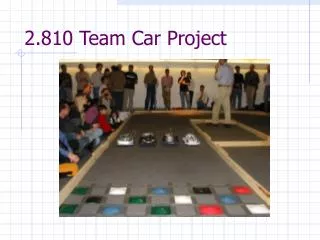
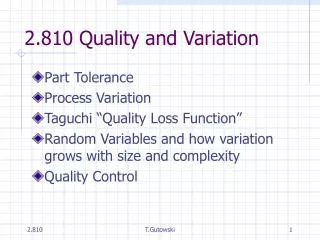
2.810 Quality and Variation. Part Tolerance Process Variation Taguchi “Quality Loss Function” Random Variables and how variation grows with size and complexity Quality Control. References;. Kalpakjian pp 982-991 (Control Charts) “Robust Quality” by Genichi Taguchi and Don Clausing

E N D
2.810 Quality and Variation • Part Tolerance • Process Variation • Taguchi “Quality Loss Function” • Random Variables and how variation grows with size and complexity • Quality Control T.Gutowski
References; • Kalpakjian pp 982-991 (Control Charts) • “Robust Quality” by Genichi Taguchi and Don Clausing • A Brief Intro to Designed Experiments Taken from Quality Engineering using Robust Design by Madhav S. Phadke, Prentice Hall, 1989 • 5 homeworks due Nov 13 T.Gutowski
Lower Specification Limit Upper Specification Limit Target Product specifications are given as upper and lower limits, for example the dimensional tolerance +0.005 in. T.Gutowski
Process VariationProcess measurement reveals a distribution in output values. Discrete probability distribution based upon measurements Continuous “Normal” distribution In general if the randomness is due to many different factors, the distribution will tend toward a “normal” distribution. (Central Limit Theorem) T.Gutowski
Tolerance is the specification given on the part drawing, and variation is the variability in the manufacturing process. This figure confuses the two by showing the process capabilities in terms of tolerance. Never the less, we can see that the general variability (expressed as tolerance over part dimension) one gets from conventional manufacturing processes is on the order of to Homework problem; can you come up with examples of products that have requirements that exceed these capabilities? If so then what? T.Gutowski
We can be much more specific about process capability by measuring the process variability and comparing it directly to the required tolerance. Common measures are called Process Capability Indices (PCI’s), such as, T.Gutowski
Case 1 In this case the out of specification parts are 4.2% + 0.4% = 4.6% What are the PCI’s? Lower Specification Limit Upper Specification Limit Target T.Gutowski
Case 2 However, in general the mean and the target do not have to line up. What are the PCI’s? How many parts are out of spec? Lower Specification Limit Upper Specification Limit Target T.Gutowski
Case 1 Cp = 4s/6s = 2/3 Cpk = Min(2s/3s,2s/3s)=2/3 Out of Spec = 4.6% Case 2 Cp = 4s/6s = 2/3 Cpk = Min(1s/3s,3s/3s)=1/3 Out of Spec = 16.1% Comparison Note; the out of Spec percentages are off slightly due to round off errors T.Gutowski
20% Likelihood set will be returned Why the two different distributions at Sony? T.Gutowski
Goal Post Quality Taguchi Quality Loss Function QL = k d2 Quality Loss Deviation, d T.Gutowski
Homework Problem Estimate a reasonable factory tolerance if the Quality Loss ($) for a failure in the field is 100 times the cost of fixing a failure in the factory. Say the observed field tolerance level that leads to failure is dfield. T.Gutowski
Random variables and how variation grows with size and complexity • Random variable basics • Tolerance stack up • Product complexity • Mfg System complexity T.Gutowski
If the dimension “X” is a random variable, the mean is given by m = E(X) (1) and the variation is given by Var(x) = E[(x - m)2] (2) both of these can be obtained from the probability density function p(x). For a discrete pdf, the expectation operation is: (3) T.Gutowski
Properties of the Expectation 1. If Y = aX + b; a, b are constants, E(Y) = aE(X) + b (4) 2. If X1,…Xn are random variables, E(X1 + … + Xn) = E(X1) +…+ E(Xn) (5) T.Gutowski
Properties of the Variance 1. For a and b constants Var(aX + b) = a2Var(X) (6) 2. If X1,…..Xn are independent random variables Var(X1+…+ Xn) = Var(X1)+ Var(X2)+ + Var(Xn) (7) T.Gutowski
If X1 and X2 are random variables and not necessarily independent, then Var(X1 + X2) = Var(X1) + Var(X2) + 2Cov(X1Y) (8) this can be written using the standard deviation “s”, and the correlation “r” as (9) where L = X1 + X2 T.Gutowski
If X1 and X2 are correlated (r = 1), then (14) for X1 = X2 = X0 (15) for N (16) or (17) T.Gutowski
Now, if X1 and X2 are uncorrelated (r = 0) we get the result as in eq’n (7) or, (10) and for N (11) If X1=X=Xo(12) Or (13) T.Gutowski
Complexity and Variation As the number of variables grow so does the variation in the system; This leads to; more complicated systems may be more likely to fail T.Gutowski
Homework; Consider the final dimension and variation of a stack of n blocks. 1, 2 …… n If USL – LSL = D, s = s’, and Cp = 1 • How many parts are out of compliance? • Now USL-LSL=D, s=10s’, what is Cp? How many parts are out of spec? • Repeat a) with s=100s’ Assume that m = target. T.Gutowski
Homework Problem: Experience shows that when composites are cured by autoclave processing on one sided tools the variation in thickness is about 7%. After careful measurements of the prepreg thickness it is determined that their variation is about 7%. What can you tell about the source of variation? T.Gutowski
Quality Control Disturbances, “d”; temperature, humidity, vibrations, dust, sunlight Inputs “I”; Mat’l, Energy, Info Machine “M” Outputs, “X” Operator inputs,”u”; initial settings, feedback, action? T.Gutowski
Who controls what? Physical Plant, etc X = f (M, I, u, d) Equipment Purchase Operator, Real Time Control So who is in charge of quality? Q.C., Utilities, etc T.Gutowski
How do you know there is a quality problem? • Detection • Measurement • Source Identification • Action • Goal should be prevention T.Gutowski
Detection • Make problems obvious • Poke yoke at the process level • Clear flow paths and responsibility • Andon board • Simplify the system • Stop operations to attend to quality problems • Stop line • Direct attention to problem • Involve Team T.Gutowski
Measurement • Statistical Process Control Upper Control Limit Centerline Average value x Lower Control Limit Sampling period T.Gutowski
Statistical Process Control Issues • Sampling Period • Establish Limits • Sensitivity to Change T.Gutowski
Source Identification; Ishikawa Cause and Effect Diagram Man Machine Effect Material Method Finding the cause of a disturbance is the most difficult part of quality control. There are only aids to help you with this problem solving exercise like the Ishikawa Diagrams which helps you cover all categories, and the “5 Whys” which helps you go to the root cause. T.Gutowski
Truck front suspension assemblyProblem; warranty rates excessive T.Gutowski
Setting the best initial parameters • Tables and Handbooks • E.g. Feeds and speeds • Models • E.g. Moldflow for injection molding • Designed Experiments • E.g. Orthogonal Arrays T.Gutowski
Designed Experiments • Temp “T” (3 settings) • Pressure “P” (3 settings) • Time “t” (3 values) • Cleaning Methods “K” (3 types) How Many Experiments? One at a time gives 34 = 81 T.Gutowski
But what if we varied all of the factors at once? Our strategy would be to measure one of the factors, say temperature, while “randomizing” the other factors. For example measure T2 with all combinations of the other factors e.g. (P,t,K) = (123), (231), (312). Notice that all levels are obtained for each factor. T.Gutowski
“Orthogonal Array” for 4 factors at 3 levels. Only 9 experiments are needed T.Gutowski
Homework Can you design an orthogonal array for 3 factors at 2 levels? T.Gutowski
Summary – the best ways to reduce variation • Simplify design • Simplify the manufacturing system • Plan on variation and put in place a system to address it T.Gutowski
Aircraft engine case study T.Gutowski
engine A1 engine A2 engine B1 engine B2 engine C1 engine C2 number of part numbers ~2,000 ~2,000 ~1,400 ~1,300 4,465 3,485 total number of parts ~15,000 ~19,000 ~7,000 ~7,000 26,073 23,580 weight [lb] 2.3k-3.5k 9k-10k 1.5k-1.6k 1.5k-1.6k 2.3k-3.5k 1.5k-1.6k thrust [lb] unless otherwise noted 14k-21k 40k-50k 4k-5k hp 7k-9k 14k-21k 7k-9k Engine “complexity” by-pass ratio 0.36:1 4.9:1 - 5.15:1 0.34:1 6.2:1 engine A1 engine A2 engine B1 engine B2 engine C1 engine C2 annual production 150 150 110 150 150 286 planned through- put time [days] 15 20 8 10 23 21 approx. takt time [shifts/engine] 7.30 7.30 6.64 4.87 4.87 2.55 Engine Data T.Gutowski
Scheduled build times Vs part count Scheduled build times T.Gutowski
Engine Delivery Late Times T.Gutowski
Late times compared to scheduled times T.Gutowski
Reasons for delay at site A T.Gutowski
Reasons for delay at site B (Guesses) T.Gutowski
Reasons for delay at site A (data) T.Gutowski
Engines shipped over a 3 month period at aircraft engine factory “B” T.Gutowski
Engines shipped over a 3 month period at aircraft engine factory “C” T.Gutowski