Download
1 / 30
310 likes | 499 Views
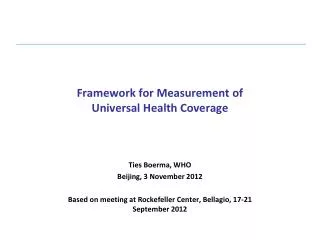
Framework for Measurement of Service Coverage Dimension of Universal Health Coverage. Ties Boerma, WHO Measuring and Monitoring Country Progress towards UHC Concepts, Indicators, and Experiences Washington DC, 20 July 2012. Monitoring and evaluation results chain. Impact Health status

E N D
Framework for Measurement of Service Coverage Dimension of Universal Health Coverage Ties Boerma, WHO Measuring and Monitoring Country Progress towards UHC Concepts, Indicators, and Experiences Washington DC, 20 July 2012
Monitoring and evaluation results chain Impact Health status Financial risk protection Responsiveness Inputs & processes Health Financing Health workforce Infrastructure Information Governance Outputs Service access and readiness Service quality and safety Service Utilization Eligibility for a form of financial risk protection Outcomes Coverage of interventions Risk factors Level and distribution (equity)
Definitions Tanahashi T. Health service coverage and its evaluation. Bull WHO1978;56(2):295. Shengelia B, Murray CJL, Adams OB. Beyond Access and Utilization: Defining and Measuring Health System Coverage. Health Systems Performance Assessment: Debate, New Methods, and New Empiricism. Geneva: World Health Organization; 2003 • Access: whether the health services that people might need are available, of good quality, and close to them • Coverage of interventions: whether the people who need an intervention actually receive it • Effective coverage: whether the people who need health intervention obtain them in a timely manner and at a level of quality necessary to obtain the desired effect; health gain • Obstacles to obtaining effective coverage: physical access, affordability, acceptability for reasons such as culture or religion, and poor service quality. • Financial affordability is not only instrument but intrinsic goal 3
Measuring progress towards the service coverage dimension of UHC – key issues to consider 4 Contents of the indicators/index Index or tracer indicators Equity dimension Output / proxy indicators Quality of services Measurement gaps Post 2015 development agenda Global and country perspectives
Contents of the indicators / index Source: WHO. A comprehensive global monitoring framework including indicators and voluntary global targets for the prevention and control of NCD. Second discussion paper. 2012. 5 Proven interventions with large health impact that can be measured MDG related interventions / communicable diseases: MNCH, HIV/TB/malaria Epidemiological transition - NCD and other interventions important : UNGA Political declaration 2011 monitoring plan; risk factors Injuries: emergency care, preventive measures
Index or tracer indicators Coverage index gap: difference between poorest and wealthiest quintiles. Source: Boerma, J. T., J. Bryce, et al. (2008). "Mind the gap: equity and trends in coverage of maternal, newborn, and child health services in 54 Countdown countries." Lancet 371(9620): 1259‐1267. • Tracer indicators: selected interventions (no more than 5), target 100%, equity can be done well; disadvantage "gaming" • Index based on intervention areas capturing the full range of services of UHC; intervention areas rather than indicators – Countdown MNCH coverage index 6
Equity dimension Source: Country profile. Countdown 2015 for Maternal Newborn and Child Health. 2012. 7 Major weakness of the health MDGs UHC is about equity: should include levels and distribution according to key stratifiers. Intervention coverage among the poorest (or other disadvantaged population) could be a good tracer indicator of progress towards UHC. Excludes the use of statistical modeling to arrive at estimates
Input / Output proxy indicators Annual number of OPD visits per person, China 1993-2008 OECD average (Range 2.5-13) Source: Data from NHSS China. 8 • Inputs: money not suitable as proxy for access/coverage measure, but relevant • Outputs: level and distribution of service outputs: index (SARA) • Service availability: density of infrastructure (facilities, beds) and specific services; proximity • Service readiness: a set of minimum conditions to provide services in terms of basic infrastructure, health workforce, diagnostics, treatment and universal precautions • Service utilization: OPD or admission rates
Example: service availability, 17 districts, SARA 2010, Zambia Maternity beds density (per 1000 pregnant women) by district, Zambia 2010. Core health workers density (per 10 000 population) by district, Zambia 2010. Source: Ministry of Health and WHO. Zambia service availability and readiness assessment 2010. Summary report. Geneva. 2012.
Example: service readiness family planning, 8 districts, Zambia SARA 2008 and 2010 Source: Ministry of Health and WHO. Zambia service availability and readiness assessment 2010. Summary report. Geneva. 2012.
Quality of care measurement 30 day hospital mortality rates after AMI, OECD Five-year cancer survival rates, OECD Cervix Breast Source: Data from NHSS China. • More complex, often many indicators (e.g. Agency for Healthcare Research and Quality (AHRQ) in USA over 200 indicators in use; OECD HCQI set of indicators linking quality of health services and health system performance • Measurement more difficult; comparability an issue • In low income setting service availability & readiness is a proxy for quality; SPA – exit interviews, observation; STI PI6 & PI7 experience 11
Measurement gaps & investments • UHC monitoring will need investment in monitoring • Surveys: NCD interventions especially need work • Facility: improvement quality, transparency, innovation 12 Issues: (1) availability of good standard measurement method (2) data collection frequency (3) data quality Surveys: especially good on preventive intervention coverage measures; denominator (need) problems; 3-5 year intervals Facility data: quality data numerator, denominator projections; annual
Post 2015 development agendaPossible linkages with UHC measurement • Health as an impact measure of development • Health as contributor to development / beneficiary • Health as human right • Health status measure, e.g. (healthy) life expectancy, as summary measure (with equity) • Universal health coverage good candidate 13 • Development focus: • Inclusive economic development • Sustainable development • Human development: education, health, nutrition • Security • All country focus instead of low income country focus • Likely with only few health indicators at the top, covering all areas
Global and country perspectives Country • Global framework and guidance • Monitoring and reporting responsibilities clear • Country specificity: different epidemiology, different priority interventions for UHC – flexible coverage index or different set of tracer indicators 14 Global Few indicators, lessons learnt from the MDG monitoring Uniform targets Monitoring and reporting responsibilities clear Investment in measurement / monitoring
Coverage index, based on intervention areas with tracer indicators within each areas
Summary points Service coverage as part of UHC can be measured and monitored but there will be measurement gaps especially for NCD (and curative care) Coverage index and set of tracer indicators with equity a key feature; focus on intervention "areas"; support with service output data Country-specificity including small "core" for global monitoring Combining coverage with financial protection into index would be ideal but challenging Only if the resulting measure is simple and appealing, UHC stands a chance of being included at a high level in the post 2015 development agenda monitoring 16
Using Global Metrics to Measure Country Performance: Lessons Learned During the MDG Countdown Ties Boerma, WHO Measuring and Monitoring Country Progress towards UHC Concepts, Indicators, and Experiences Washington DC, 20 July 2012
Tracks country-level coverage for interventions proven to reduce maternal, newborn and child mortality and associated indicators for Policies and health system strength Financial flows Equity 75 countries with highest burden are the focus Collaboration of individuals, governments, organizations, partnerships Produces analytical reports, country profiles, global and regional events, Lancet series, link with parliamentarians, country Countdown Countdown to 2015
Coverage indicators • Inclusion of coverage indicators driven by selection of proven interventions (continuum of care) • Plus availability of reliable data to ascertain levels, trends, equity • Use of household survey data (DHS, MICS) from 75 Countdown countries, from 1990; University of Pelotas data centre + analysis • Upcoming PLoS Med series of papers to assess issues related to quality of coverage indicators • Facility data are not used for coverage • No use of model-based estimates for coverage
Coverage index: methods • Aggregate index based on 4 intervention areas • family planning • maternal and newborn care • immunization • treatment of sick children • Different system delivery strategies; captures overall strength of the delivery system (was original intention); can add intervention areas; equity • The four intervention areas are given equal weight • Strong association with health status measures Countdown 2008 Equity Analysis Group, Lancet 2008
Monitoring and evaluation results chainRelated to health system inputs/outputs and impact Impact Health status Financial risk protection Responsiveness Inputs & processes Health Financing Health workforce Infrastructure Information Governance Outputs Service access and readiness Service quality and safety Service Utilization Eligibility for a form of financial risk protection Outcomes Coverage Index Level and distribution (equity)
Indicators in intervention areas Countdown 2008 Equity Analysis Group, Lancet 2008
Empirical data: levels and trends • The overall mean = 57% • >80% in Turkmenistan and Peru • <30% in Ethiopia and Chad • The coverage index improved by an average of 0.9 percentage point per year since the early 1990s - 2006 • Based on 40 countries with more than one survey • Fastest improvements (>2 pp/year): Cambodia, Mozambique, and Nepal • Declining index: Chad, Kenya, Zambia, and Zimbabwe Countdown 2008 Equity Analysis Group, Lancet 2008
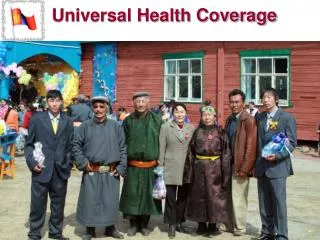
Monitoring equity in Countdown • What types stratification? • Wealth quintiles • Maternal education • Urban/rural • Gender • Ethnic groups • Etc Photos: P Menzel
Coverage gaps by country Countdown 2008 Equity Analysis Group, Lancet 2008
Coverage index, based on intervention areas with tracer indicators within each areas
Summary points • Coverage index works well in Countdown to ascertain levels, trends and inequity; good way to summarize multiple interventions • Mean coverage better understood by policy makers than coverage gap for CD – gap measure makes sense for UHC? • Dependence on surveys a disadvantage; if facility based coverage estimates are good they should be used increasingly, at least for some indicators • Denominator problems: also with survey-based coverage rates • UHC coverage index will need further methodological work, including the critical evidence based selection of core interventions • Several aspects of the CountDown model deserve consideration for UHC monitoring, including country UHC monitoring, regular global analytical reports and country profiles 29
Acknowledgement Countdown to 2015 colleagues, especially Jennifer Bryce and Cesar Victora 30