Download
1 / 36
380 likes | 680 Views
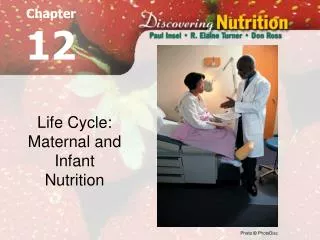
Nutrition 526 - 2012 Framing Maternal & Infant Nutrition. Healthy People 2020 Maternal, Infant and Child Health. Why do we care about maternal and infant nutritional health? What are the determinants of maternal and infant health?

E N D
Healthy People 2020 Maternal, Infant and Child Health • Why do we care about maternal and infant nutritional health? • What are the determinants of maternal and infant health? • What are some key indicators of maternal and infant nutritional health: preconceptionally,in the fetus & infant, during pregnancy?
A Life Course Framework: T2 – E2 Timeline: today’s exposures influence tomorrow’s health Timing: health trajectories are particularly affected during critical periods Environment: the broader community environment strongly affects the capacity to be healthy Equity: inequality in health reflects more than genetics and personal choice
A Public Health Approach to Maternal and Infant Health • Assessment • Policy Development • Assurance: Surveillance and monitoring progress towards goals
Assessment • Pregnancy population characteristics • Maternal health indicators • Infant health indicators
In 2008 births and birth rate were ~ 2% less than 2007; in 2009 they were ~ 3% less than 2008. http://www.cdc.gov/nchs/products/nvsr.htm
Birth rates for females ages 15–17 by race and Hispanic origin, 1980–2010 America's Children in Brief: Key National Indicators of Well-Being, 2012: Http://childstats.gov/americaschildren/fam_fig.asp#fam2a
Percentage of all births to unmarried women by age of mother, 1980 and 2010 America's Children in Brief: Key National Indicators of Well-Being, 2012: Http://childstats.gov/americaschildren/fam_fig.asp#fam2a
Population Indicators & Trends for Maternal Health • Pre-conceptual indicators • Weight gain • Diabetes in pregnancy • Pre-eclampsia • Cesarean delivery • Maternal death
Weight Gain During Pregnancy: Reexamining the Guidelines, IOM. 2009
African American and White Women Who Died of Pregnancy Complications,* United States * Annual number of deaths during pregnancy or within 42 days after delivery, per 100,000 live births. † The apparent increase in the number of maternal deaths between 1998 and 1999 is the result of changes in how maternal deaths are classified and coded. Source: CDC, National Center for Health Statistics.
Population Indicators of Infant Health • Infant mortality • Birthweight • Gestational age
Infant Mortality • Infant mortality rate – Deaths of infants aged under 1 year per 1,000 or 100,000 live births. The infant mortality rate is the sum of the neonatal and postneonatal mortality rates. • Neonatal mortality rate – Deaths of infants aged 0-27 days per 1,000 live births. The neonatal mortality rate is the sum of the early neonatal and late neonatal mortality rates • Postneonatal mortality rate – Deaths to infants aged 28 days-1 year per 1,000 live births.
http://www.chipublib.org/004chicago/disasters/infant_mortality.htmlhttp://www.chipublib.org/004chicago/disasters/infant_mortality.html
Death rates among infants by race and Hispanic origin of mother, 1983–1991 and 1995–2010 America's Children in Brief: Key National Indicators of Well-Being, 2012: Http://childstats.gov/americaschildren/fam_fig.asp#fam2a
QuickStats: Infant Mortality Rates, by Mother's Place of Birth and Race/Ethnicity --- United States,* 2007 MMWR July 8, 2011 / 60(26);891
Muntaner, C et al. ECONOMIC INEQUALITY, WORKING-CLASS POWER,SOCIAL CAPITAL, AND CAUSE-SPECIFICMORTALITY IN WEALTHY COUNTRIES. International Journal of Health Services, Volume 32, Number 4, Pages 629–656, 2002 • “In summary, the rates of low birth weight and infant deaths from all causes were lower in those countries with more voter turnout, more left votes, more left members of parliament, more years of social democratic government, more women in government, a stronger social pact and various aspects of the welfare state, and low income inequality, as measured in a variety of ways.”
Birthweight Definitions • LBW = low birthweight (less than 2,500 grams) • VLBW = Very low birthweight (less than 1,500 g • ELBW = Extremely low birthweight (less than 1,000 g) • LGA = Large for gestational age (macrosomia); > 90th %; 4,000 (ICD9) or 4,500 g
Defining Small for Gestational Age (SGA) and Large for Gestational Age (LGA)
Percentage of infants born preterm and percentage of infants born with low birthweight, 1990–2010 America's Children in Brief: Key National Indicators of Well-Being, 2012: Http://childstats.gov/americaschildren/fam_fig.asp#fam2a
Percentage of infants born with low birthweight by race and Hispanic origin of mother, 1990, 2006, and 2010 America's Children in Brief: Key National Indicators of Well-Being, 2012: Http://childstats.gov/americaschildren/fam_fig.asp#fam2a
Percentage of children ages 0–17 living in poverty by race, Hispanic origin and family type, 1980–2010 America's Children in Brief: Key National Indicators of Well-Being, 2012: Http://childstats.gov/americaschildren/fam_fig.asp#fam2a
Social-Ecological Model for Determinants of Access to Resources & Nutrition Behaviors Structures, Policies, Systems Local, state, federal policies and laws Institutions Rules, regulations, policies & informal structures Community Social Networks, Norms, Standards Interpersonal Family, peers, social networks, associations Individual Knowledge, attitudes, beliefs
Individual - Pregnancy • Physiology and Psychology of Pregnancy • Maternal Preconceptional status • Inter-generational programming • Diet in pregnancy: energy/weight gain, macro & micronutrients • Behaviors that impact nutritional status • Substances: alcohol, caffeine, tobacco, drugs • Physical activity • Oral health • Pregnancy intendedness • Stage of development: adolescence • High risk situations: GDM, Hypertensive disorders of pregnancy
Intrapersonal/Community • Social and cultural environments • Support from friends and family • Health and nutrition care providers
Institutional • Hospital breastfeeding & formula policies • Child Care policies • School policies for pregnant and parenting teens • Worksite lactation policies
Policy & Environment • Nutrition Assistance Programs for pregnancy, lactation and early childhood. • Insurance policies for lactation support • Parental leave policies